Adaptive dynamische Handelsstrategie basierend auf normalisierten logarithmischen Renditen

Überblick
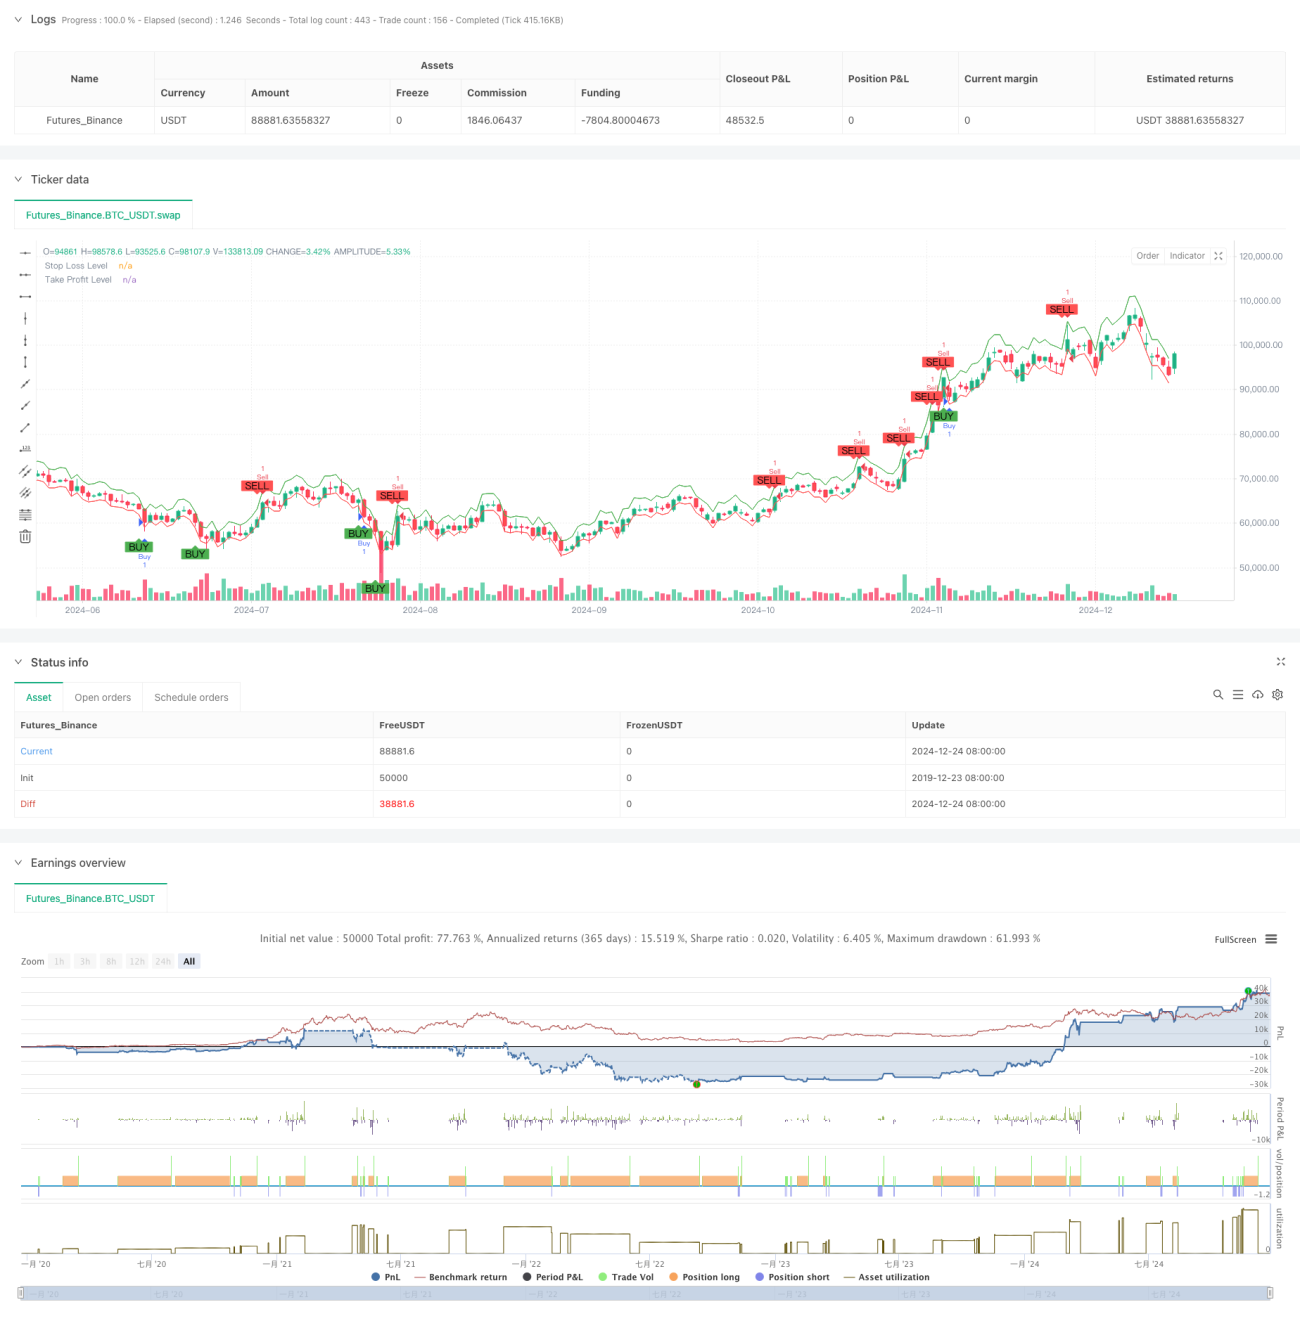
Die Strategie ist ein adaptives Handelssystem, das auf dem Shiryaev-Zhou-Index (SZI) basiert. Es identifiziert überkaufte und überverkaufte Zustände des Marktes durch Berechnung eines standardisierten Punktes für die logische Rendite und fängt so die Gelegenheit für eine mittlere Rückkehr des Preises ein. Die Strategie kombiniert dynamische Stop-Loss- und Profit-Goals und ermöglicht eine präzise Risikokontrolle.
Strategieprinzip
Im Zentrum der Strategie steht der Aufbau eines standardisierten Indikators durch rollende statistische Merkmale der logarithmischen Rendite. Die konkreten Schritte lauten:
- Berechnen Sie die parallelen Renditen, um eine normalisierte Behandlung der Renditen zu erreichen
- Berechnung des Rollenden Durchschnitts und der Standarddifferenz mit einem 50-Zyklus-Fenster
- Konstruieren Sie SZI-Indikatoren: (logarithmische Rendite - Rolling Average) / Rolling Standard Differenz
- Wenn SZI unter -2,0 ist, erzeugt mehrere Signale, wenn er über 2,0 ist, erzeugt er ein Leerzeichen
- Setzen Sie 2% Stop Loss und 4% Stop Stop Level auf Basis des Einstiegspreises
Strategische Vorteile
- Die theoretische Grundlage ist solide: basierend auf der Hypothese der logarithmischen normalen Verteilung, mit guter statistischer Unterstützung
- Anpassungsfähigkeit: Fähigkeit, sich an veränderte Merkmale der Marktfluktuation durch Rollfensterberechnung anzupassen
- Perfekte Risikokontrolle: Percentage Stop-Loss-Strategien, um die Risiken für jeden Handel genau zu kontrollieren
- Visualisierungsfreundlich: Handelssignale und Risikokontrollen werden klar auf den Diagrammen markiert
Strategisches Risiko
- Parameter-Sensitivität: Die Wahl der Länge der Rollfenster und der Thresholds beeinflussen die Strategie erheblich
- Marktumfeld-Abhängigkeit: Häufige falsche Signale, die in einem Trendmarkt entstehen können
- Schlupfpunkt-Effekte: In Zeiten starker Schwankungen können die tatsächlichen Kaufpreise erheblich von den idealen Niveaus abweichen
- Berechnungsverzögerung: Die Berechnung von Statistiken in Echtzeit kann zu einer gewissen Signalverzögerung führen
Richtung der Strategieoptimierung
- Dynamische Schwellenwerte: Eine dynamische Anpassung des Signal-Schwellenwerts an die Marktfluktuation kann in Betracht gezogen werden
- Mehrzeit-Perioden: Ein Signalbestätigungsmechanismus, der mehrere Zeitperioden einführt
- Volatilitätsfilter: Haltet den Handel aus oder passt die Position während extremer Volatilität an
- Signalbestätigung: Erhöhung des Verkehrsvolumens, der Antriebskraft usw. für die Signalbestätigung
- Positionsmanagement: Dynamisches Positionsmanagement basierend auf Volatilität
Zusammenfassen
Es handelt sich um eine quantitative Handelsstrategie, die auf einer soliden statistischen Grundlage basiert und Preisschwankungen durch standardisierte symmetrische Erträge erfasst. Die Hauptvorteile der Strategie liegen in ihrer Anpassungsfähigkeit und perfekten Risikokontrolle, es besteht jedoch noch Raum für Optimierung in Bezug auf die Auswahl der Parameter und die Anpassung an die Marktumgebung. Die Stabilität und Zuverlässigkeit der Strategie wird durch die Einführung von dynamischen Abwertungen und mehrdimensionalen Signalbestätigungsmechanismen weiter verbessert werden.
- 1