Mehrfache gleitende Durchschnittskreuzungen kombiniert mit Oszillator und dynamischer Handelsstrategie für Unterstützung und Widerstand

Überblick
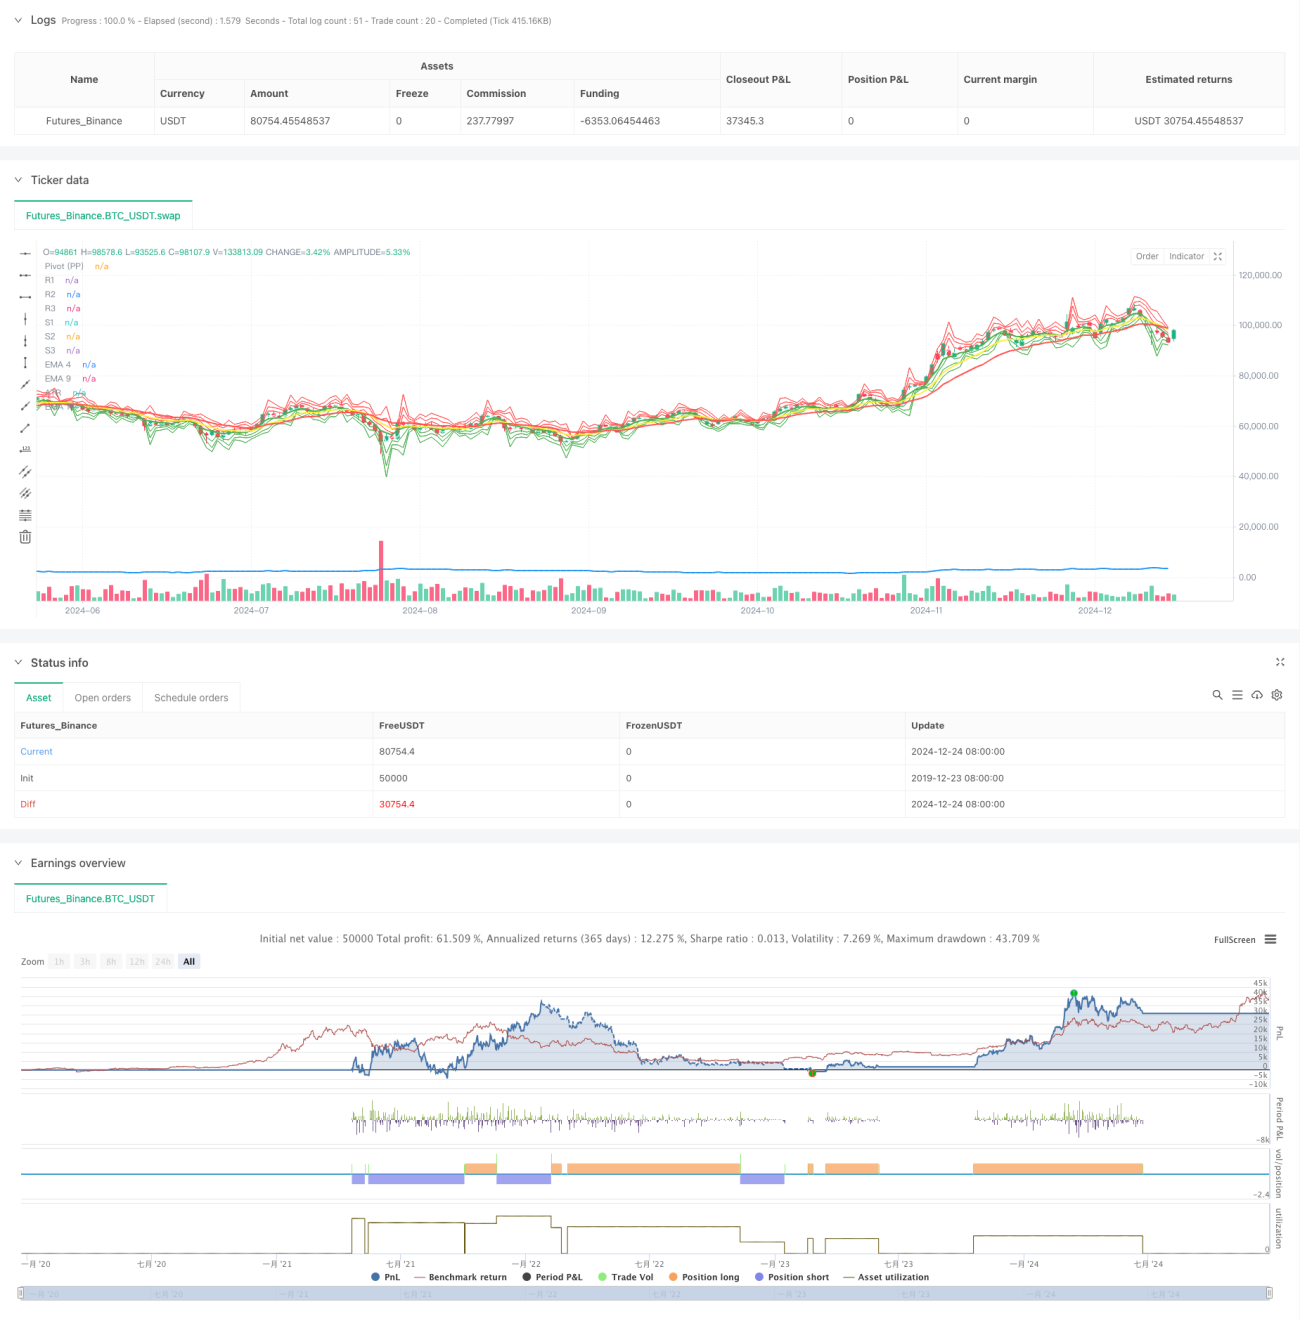
Die Strategie ist ein integriertes Handelssystem, das eine Kombination aus Multiple-Index-Moving Averages (EMA) -Kreuzungen, realen Volatilitätsbreiten (ATR) und Pivot-Support-Resistenzen (Pivot Points) kombiniert. Die Strategie erfasst die Trendwendepunkte in den Märkten in Kombination mit ATR-Schwankungen und wichtigen Preisniveaus durch die Kreuzung von kurzfristigen EMAs mit mittleren und langfristigen EMAs.
Strategieprinzip
Die Strategie basiert auf einer technischen Analyse in drei Dimensionen:
- Trenderkennung: Die Richtung des Trends wird mit einem Dreifach-EMA in den Phasen 4, 9 und 18 bestätigt, indem das kurzfristige EMA (Phasen 4) mit dem mittelfristigen EMA (Phasen 9) und dem langfristigen EMA (Phasen 18) synchronisiert wird.
- Bandbreite: Einführung eines 14-Perioden-ATR-Index, um die Marktvolatilität zu quantifizieren und dynamische Handelsschwellen zu setzen.
- Preisunterstützungswiderstand: Die 7 Schlüsselpreisniveaus werden erstellt (PP, R1-R3, S1-S3) und dienen als Referenz für den Handel.
Die Regeln für den Handel sind klar:
- Mehrere Bedingungen: EMA4 überschreitet EMA9 und EMA18 nach oben, und der Schlusskurs durchbricht die ATR-Distanz oberhalb der EMA9
- Auflösungsbedingungen: EMA4 nach unten durchschreitet EMA9 und EMA18, und der Schlusskurs durchbricht die ATR-Distanz unterhalb der EMA9
- Stop-Loss-Einstellungen: Dynamische Verfolgung der EMA4-Ebene
Strategische Vorteile
- Multidimensionelle Analyse: Die drei Dimensionen von Trend, Schwankung und Preisstruktur werden kombiniert, um die Signalsicherheit zu verbessern
- Dynamische Anpassung: Strategie kann sich an unterschiedliche Marktumgebungen anpassen, indem sie ATRs und Widerstandspunkte dynamisch unterstützt
- Perfekte Risikokontrolle: Dynamische Stop-Loss-Mechanismen zur zeitnahen Gewinnschließung und Risikokontrolle
- Signalbestätigung ist ausreichend: Mehrfache Resonanz von technischen Kennzahlen erforderlich, um einen Handel auszulösen, um das Risiko eines falschen Durchbruchs zu verringern
Strategisches Risiko
- Marktrisiken: Häufige Falschmeldungen bei der Querverarbeitung
- Verzögerungsrisiko: Der gleitende Durchschnitt selbst weist Verzögerungen auf und Sie verpassen möglicherweise den besten Einstiegszeitpunkt.
- Gap-Risiken: Tagesaufstieg kann zum Ausfall der Stop-Loss-Punkte führen
- Parameter-Sensitivität: Verschiedene Kombinationen von Periodenparametern können deutlich unterschiedliche Effekte haben
Richtung der Strategieoptimierung
- Einführung von Traffic Indicators: Traffic Validation bei Kreuzsignalbestätigung
- Dynamische Parameteroptimierung: Anpassung der EMA-Zyklusparameter an die Marktschwankungen
- Verbesserte Stop-Loss-Mechanismen: Erwägung in Kombination mit ATR-Einstellungen
- Marktumgebungsfilter: Hinzufügen von Trendstärken, um den Handel während eines starken Trends zu eröffnen
- Zeitfilter: Features für verschiedene Zeiträume, um optimale Handelszeiten einzustellen
Zusammenfassen
Die Strategie basiert auf der Synergie von mehreren technischen Indikatoren, um ein relativ vollständiges Handelssystem zu schaffen. Die Kernvorteile der Strategie liegen in der mehrdimensionalen Signalbestätigung und dem ausgefeilten Risikokontrollsystem, aber die Optimierung der Parameter und die Verbesserung der Systeme durch die Händler im Hinblick auf die spezifischen Marktbedingungen sind noch erforderlich. Durch die empfohlene Optimierungsrichtung wird die Stabilität und Zuverlässigkeit der Strategie voraussichtlich weiter verbessert.
- 1