
Überblick
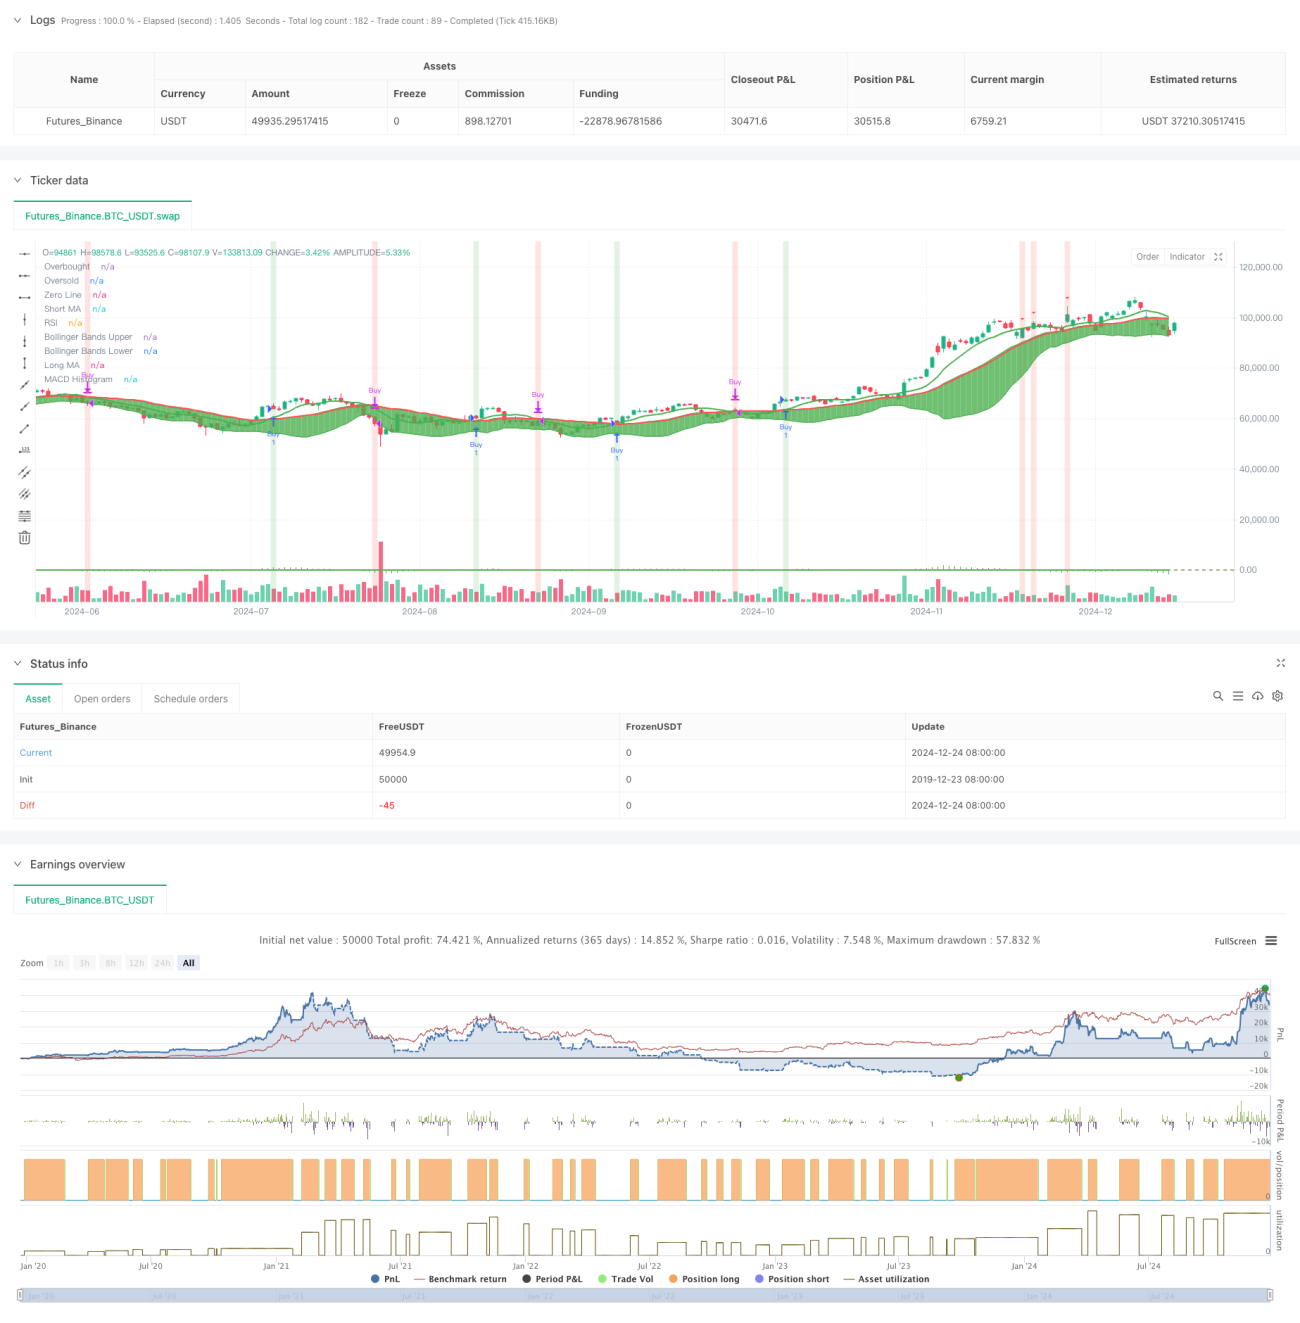
Die Strategie ist ein umfassendes Handelssystem, das mehrere klassische technische Indikatoren kombiniert, darunter gleitender Durchschnitt (MA), Relative-Stärke-Index (RSI), Moving Average Convergence Divergence (MACD) und Bollinger Bands (BB). Das System nutzt die koordinierte Zusammenarbeit dieser Indikatoren, um genauere Kauf- und Verkaufssignale auf dem Markt zu finden und so die Erfolgsquote von Transaktionen zu verbessern.
Strategieprinzip
Die Strategie verwendet einen mehrschichtigen Signalüberprüfungsmechanismus, der hauptsächlich die folgenden Aspekte umfasst:
- Bestimmen Sie die zugrunde liegende Trendrichtung anhand der Kreuzungspunkte der kurzfristigen (9-Tage) und langfristigen (21-Tage) gleitenden Durchschnitte.
- Verwenden Sie RSI (14 Tage), um überkaufte und überverkaufte Bereiche zu identifizieren, und legen Sie 70 und 30 als Schlüsselniveaus fest
- Verwenden Sie MACD (12, 26, 9), um die Stärke des Trends und mögliche Wendepunkte zu bestätigen
- Verwenden Sie Bollinger-Bänder (20 Tage, 2 Standardabweichungen), um den Bereich der Preisschwankungen und mögliche Umkehrpunkte zu bestimmen
Das System generiert Handelssignale unter folgenden Bedingungen:
- Wichtiges Kaufsignal: Kurzfristiger MA kreuzt den langfristigen MA
- Wichtiges Verkaufssignal: Kurzfristiger MA unterschreitet langfristigen MA
- Zusätzliche Kaufsignale: RSI liegt unter 30, MACD-Histogramm ist positiv und der Preis berührt das untere Bollinger-Band
- Zusätzliche Verkaufssignale: RSI liegt über 70 und das MACD-Histogramm ist negativ und der Preis berührt das obere Bollinger-Band
Strategische Vorteile
- Mehrdimensionale Analyse: Durch die Integration mehrerer technischer Indikatoren wird eine umfassendere Marktanalyseperspektive bereitgestellt
- Signalbestätigungsmechanismus: Die Kombination von Haupt- und Hilfssignalen kann die Auswirkung falscher Signale verringern
- Perfekte Risikokontrolle: Nutzen Sie die Kombination aus Bollinger Bands und RSI, um das Risiko von Einstiegspunkten zu kontrollieren
- Trendverfolgungsfähigkeit: Durch die Zusammenarbeit von MA und MACD können wir nicht nur den Haupttrend erfassen, sondern auch den Wendepunkt des Trends identifizieren
- Starker Visualisierungseffekt: Das System bietet eine klare grafische Benutzeroberfläche mit Hintergrundfarbaufforderungen und Formmarkierungen
Strategisches Risiko
- Signalhysterese: Der gleitende Durchschnitt selbst weist eine Hysterese auf, was zu einem suboptimalen Einstiegspunkt führen kann.
- Risiko eines volatilen Marktes: In einem seitwärts gerichteten und volatilen Markt können häufig falsche Signale auftreten
- Widersprüchliche Indikatoren: Mehrere Indikatoren können zu bestimmten Zeiten widersprüchliche Signale erzeugen
- Parametersensitivität: Die Wirkung der Strategie ist empfindlich gegenüber der Parametereinstellung und erfordert eine ausreichende Parameteroptimierung.
Richtung der Strategieoptimierung
- Dynamische Parameteranpassung: Die Parameter jedes Indikators können automatisch entsprechend der Marktvolatilität angepasst werden.
- Klassifizierung des Marktumfelds: Fügen Sie einen Erkennungsmechanismus für unterschiedliche Marktumfelder hinzu und verwenden Sie unterschiedliche Signalkombinationen unter unterschiedlichen Marktbedingungen.
- Verbesserter Stop-Loss-Mechanismus: Fügen Sie flexiblere Stop-Loss-Systeme hinzu, wie z. B. Trailing Stop Loss oder ATR-basierter Stop Loss
- Optimierung des Positionsmanagements: Passen Sie die Positionsgröße dynamisch an die Signalstärke und Marktvolatilität an.
- Zeitrahmenkoordination: Erwägen Sie die Hinzufügung mehrerer Zeitrahmenanalysen, um die Signalzuverlässigkeit zu verbessern
Zusammenfassen
Dies ist ein gut konzipiertes mehrdimensionales Handelsstrategiesystem, das Handelssignale durch die Synergie mehrerer technischer Indikatoren liefert. Die Hauptvorteile der Strategie liegen in ihrem umfassenden Analyserahmen und ihrem strengen Signalbestätigungsmechanismus, allerdings müssen auch Aspekte wie Parameteroptimierung und Anpassungsfähigkeit an das Marktumfeld berücksichtigt werden. Durch die empfohlenen Optimierungsrichtungen ist bei dieser Strategie noch viel Luft nach oben.
- 1