Durchbruchstrategie für intelligente IKT-Strukturen basierend auf der Kombination dynamischer Signale über mehrere Zeiträume

RSI MACD EMA BOS FVG HTF LTF ICT
Erstellungsdatum: 2025-01-06 14:09:05 zuletzt geändert: 2025-01-06 14:09:05
Kopie: 0 Klicks: 456
1
konzentrieren Sie sich auf
1617
Anhänger

Durchbruchstrategie für intelligente IKT-Strukturen basierend auf der Kombination dynamischer Signale über mehrere Zeiträume

Überblick

Die Strategie ist ein umfassendes Handelssystem, das mehrere technische Indikatoren und ICT (Institutional Trading Concept) kombiniert. Es integriert traditionelle technische Analyseindikatoren (RSI, stochastische Indikatoren, MACD, EMA) und moderne ICT-Handelskonzepte (Fair Value Gap, struktureller Durchbruch, High Time Period Bias-Analyse) in verschiedenen Zeiträumen und filtert durch strenge Handelsperioden. Erzielen Sie präzise Markt Zugangskontrolle.

Strategieprinzip

Die Strategie basiert auf der Koordination von fünf Kernkomponenten:

  1. Analyse der Verzerrung über einen langen Zeitraum: Verwenden Sie den gleitenden 200-Tage-Durchschnitt, um die Markttrendrichtung über einen längeren Zeitraum zu bestimmen.
  2. Handelszeitfilter: Beschränken Sie den Handel auf eine bestimmte „Kill Zone“ (07:00-10:00)
  3. Fair Value Gap (FVG)-Identifizierung: Identifizierung struktureller Lücken im Markt durch drei K-Linien-Muster
  4. Breakout of Structure (BOS)-Bestimmung: Ein Durchbruch basierend auf einem wichtigen Preisniveau bestätigt eine Richtungsänderung
  5. Bestätigung des Indikators für kurze Zeiträume: Mehrfachüberprüfung mithilfe von RSI, stochastischem Indikator, MACD und gleitendem Durchschnitt von 200

Strategische Vorteile

  1. Mehrdimensionale Signalintegration: Verbessern Sie die Signalzuverlässigkeit durch die Kombination mehrerer unabhängiger technischer Indikatoren und IKT-Konzepte
  2. Zeitzykluskoordination: Die Koordination von High- und Low-Zeitzyklen verbessert die Stabilität des Signals
  3. Erfassung struktureller Chancen: Konzentration auf strukturelle Handelschancen mit hoher Wahrscheinlichkeit durch die Identifizierung von FVG und BOS
  4. Perfekte Risikokontrolle: inklusive Stop-Loss- und Stop-Profit-Mechanismus, standardisiertes Fondsmanagement
  5. Handelszeitoptimierung: Reduzieren Sie Störungen außerhalb der Handelszeiten durch Zeitfilterung

Strategisches Risiko

  1. Signalverzögerung: Die Kombination mehrerer Indikatoren kann zu einer Verzögerung des Einstiegszeitpunkts führen
  2. Unruhige Marktentwicklung: In einem Seitwärtsmarkt können häufig Fehlsignale auftreten
  3. Parametersensitivität: Die Einstellung mehrerer Indikatorparameter erfordert eine ausreichende Überprüfung historischer Daten
  4. Ausführungsrisiko: Eine komplexe Kombination von Bedingungen kann dazu führen, dass im realen Handel einige Handelsmöglichkeiten verpasst werden
  5. Abhängigkeit vom Marktumfeld: Die Performance von Strategien in unterschiedlichen Marktumfeldern kann stark variieren

Richtung der Strategieoptimierung

  1. Dynamische Parameteranpassung: Passen Sie die Parameter jedes Indikators adaptiv an die Marktvolatilität an.
  2. Klassifizierung des Marktumfelds: Fügen Sie ein Modul zur Identifizierung des Marktumfelds hinzu und verwenden Sie unterschiedliche Parameterkombinationen für unterschiedliche Marktbedingungen
  3. Optimierung der Signalgewichtung: Einführung maschineller Lernmethoden zur Optimierung der Gewichtsverteilung verschiedener Indikatoren
  4. Erweiterung des Zeitraums: Fügen Sie weitere Zeiträume für die Analyse hinzu und verbessern Sie die Signalzuverlässigkeit
  5. Verbesserte Risikokontrolle: Einführung eines dynamischen Stop-Loss-Mechanismus und Optimierung der Fondsmanagementstrategien

Zusammenfassen

Diese Strategie baut ein umfassendes Handelssystem auf, indem sie traditionelle technische Analysen mit modernen IKT-Konzepten integriert. Seine Vorteile liegen in der mehrdimensionalen Signalbestätigung und der strengen Risikokontrolle, es gibt jedoch auch Herausforderungen bei der Parameteroptimierung und Marktanpassungsfähigkeit. Durch kontinuierliche Optimierung und Verbesserung soll die Strategie eine stabile Leistung in unterschiedlichen Marktumgebungen aufrechterhalten.
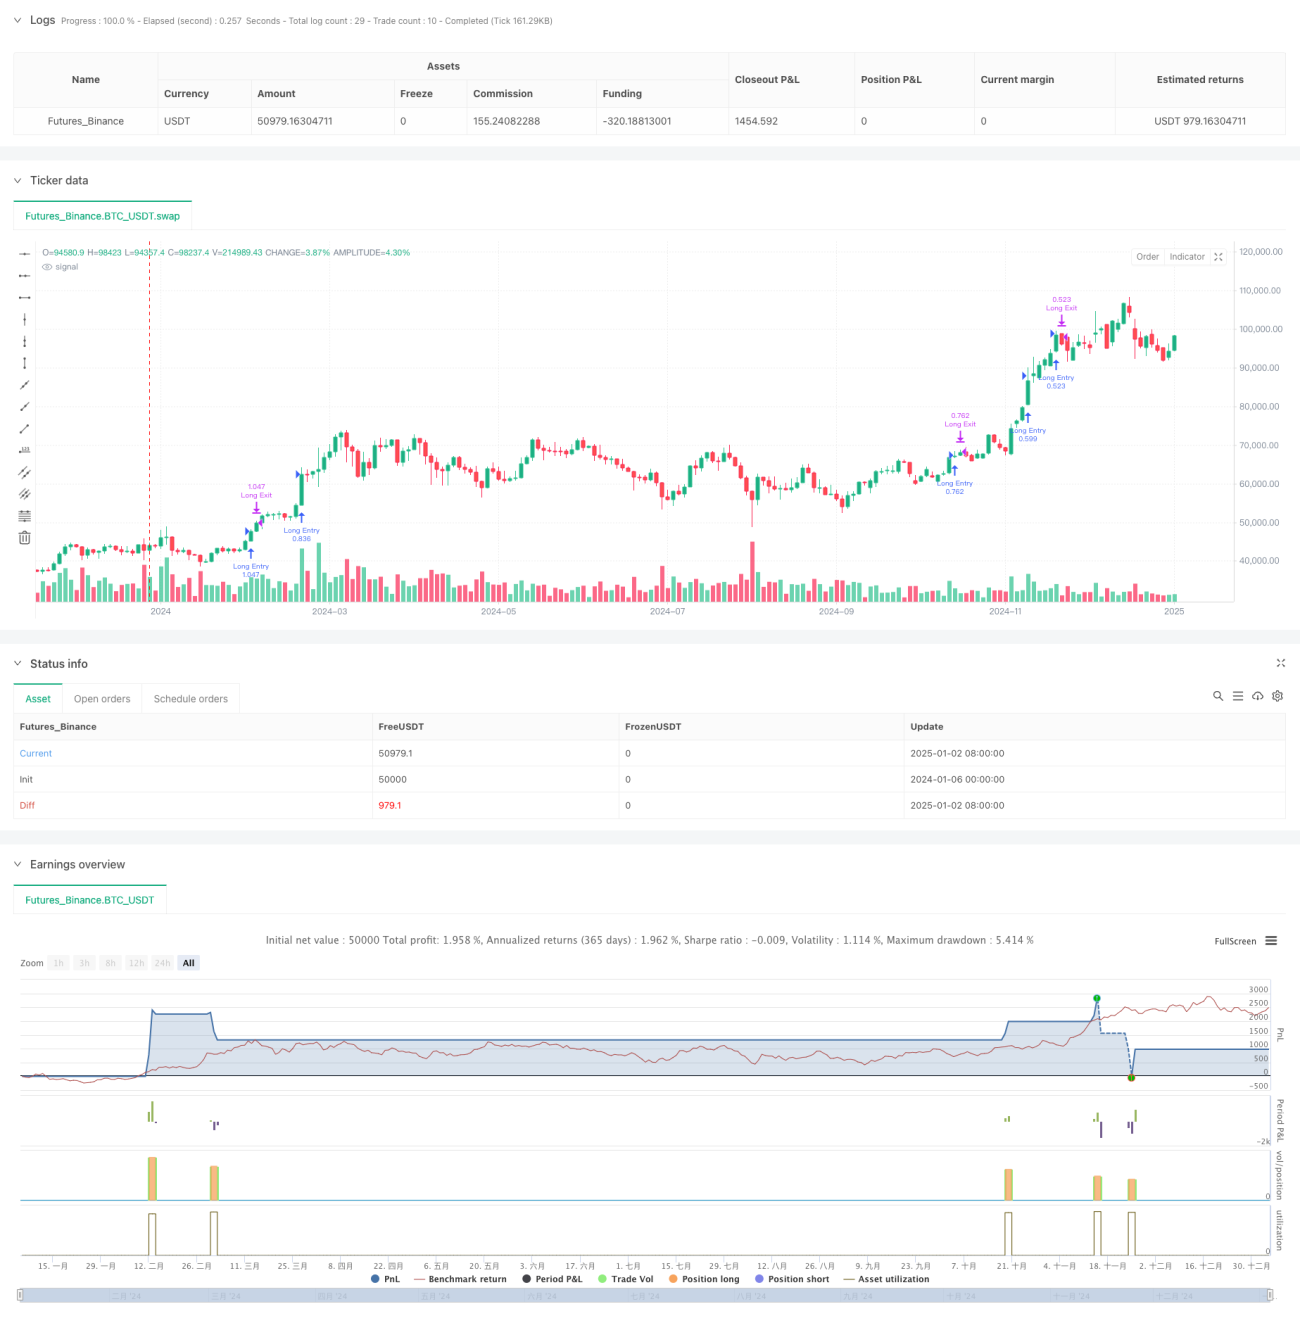
Strategiequellcode
/*backtest
start: 2024-01-06 00:00:00
end: 2025-01-04 08:00:00
period: 2d
basePeriod: 2d
exchanges: [{"eid":"Futures_Binance","currency":"BTC_USDT"}]
*/

// -----------------------------------------------------
// Multi-Signal Conservative Strategy (Pine Script v5)
// + More ICT Concepts (HTF Bias, FVG, Killzone, BOS)
// -----------------------------------------------------
//
// Combines:
// - RSI, Stochastic, MACD, 200 EMA (lower TF)
// - Higher Timeframe (HTF) bias check via 200 EMA
// - Kill Zone time filter
// - Fair Value Gap (FVG) detection (simplified 3-candle approach)
// - Break of Structure (BOS) using pivot highs/lows
// - Only trade markers on chart (no extra indicator plots).
//
// Use on lower timeframes: 1m to 15m
// Always backtest thoroughly and manage risk properly.
//
// -----------------------------------------------------
//@version=5
strategy(title="Multi-Signal + ICT Concepts (HTF/FVG/Killzone/BOS)", shorttitle="ICTStrategyExample",overlay=true, pyramiding=0, initial_capital=10000, default_qty_type=strategy.percent_of_equity, default_qty_value=100)

// -----------------------------------------------------
// User Inputs
// -----------------------------------------------------
/////////////// Lower TF Inputs ///////////////
emaLength       = input.int(200,   "LTF EMA Length",           group="Lower TF")
rsiLength       = input.int(14,    "RSI Length",               group="Lower TF")
rsiUpper        = input.int(60,    "RSI Overbought Thresh",    group="Lower TF", minval=50, maxval=80)
rsiLower        = input.int(40,    "RSI Oversold Thresh",      group="Lower TF", minval=20, maxval=50)
stochLengthK    = input.int(14,    "Stoch K Length",           group="Lower TF")
stochLengthD    = input.int(3,     "Stoch D Smoothing",        group="Lower TF")
stochSmooth     = input.int(3,     "Stoch Smoothing",          group="Lower TF")
macdFast        = input.int(12,    "MACD Fast Length",         group="Lower TF")
macdSlow        = input.int(26,    "MACD Slow Length",         group="Lower TF")
macdSignal      = input.int(9,     "MACD Signal Length",       group="Lower TF")

/////////////// ICT Concepts Inputs ///////////////
htfTimeframe    = input.timeframe("60", "HTF for Bias (e.g. 60, 240)", group="ICT Concepts")
htfEmaLen       = input.int(200,  "HTF EMA Length",                   group="ICT Concepts")
sessionInput    = input("0700-1000:1234567", "Kill Zone Window", group="ICT Concepts")
fvgLookbackBars = input.int(2,    "FVG Lookback Bars (3-candle check)",  group="ICT Concepts", minval=1, maxval=10)

/////////////// Risk Management ///////////////
stopLossPerc    = input.float(0.5, "Stop-Loss %",  step=0.1, group="Risk")
takeProfitPerc  = input.float(1.0, "Take-Profit %", step=0.1, group="Risk")

// -----------------------------------------------------
// 1) Higher Timeframe Bias
// -----------------------------------------------------
//
// We'll request the HTF close, then compute the HTF EMA on that data
// to decide if it's bullish or bearish overall.

htfClose       = request.security(syminfo.tickerid, htfTimeframe, close)
htfEma         = request.security(syminfo.tickerid, htfTimeframe, ta.ema(close, htfEmaLen))
isBullHTF      = htfClose > htfEma
isBearHTF      = htfClose < htfEma

// -----------------------------------------------------
// 2) Kill Zone / Session Filter
// -----------------------------------------------------
//
// We'll only consider trades if the current bar is within
// the user-defined session time (e.g., 07:00 to 10:00 local or exchange time).

isInKillZone = time(timeframe.period, sessionInput) != 0

// -----------------------------------------------------
// 3) Fair Value Gap (FVG) Detection (Simplified)
//
// For a "Bullish FVG" among bars [2], [1], [0]:
//     high[2] < low[0] => there's a gap that bar [1] didn't fill
// For a "Bearish FVG":
//     low[2] > high[0] => there's a gap that bar [1] didn't fill
//
// Real ICT usage might check partial fill, candle bodies vs wicks, etc.
// This is just a minimal example for demonstration.

fvgBarsAgo = fvgLookbackBars // default = 2
bullFVG = high[fvgBarsAgo] < low  // e.g. high[2] < low[0]
bearFVG = low[fvgBarsAgo]  > high // e.g. low[2]  > high[0]

// -----------------------------------------------------
// 4) Break of Structure (BOS)
// -----------------------------------------------------
// Using pivot detection from previous example:

swingLen = 2  // pivot detection length (bars on each side)
// Identify a pivot high at bar [1]
swingHigh = high[1] > high[2] and high[1] > high[0]
// Identify a pivot low at bar [1]
swingLow  = low[1]  < low[2]  and low[1]  < low[0]

// Track the most recent pivot high & low
var float lastPivotHigh = na
var float lastPivotLow  = na

if swingHigh
    lastPivotHigh := high[1]

if swingLow
    lastPivotLow := low[1]

bosUp   = not na(lastPivotHigh) and (close > lastPivotHigh)
bosDown = not na(lastPivotLow)  and (close < lastPivotLow)

// -----------------------------------------------------
// 5) Lower TF Indicator Calculations
// -----------------------------------------------------
ema200      = ta.ema(close, emaLength)  // 200 EMA on LTF
rsiValue    = ta.rsi(close, rsiLength)
kValue      = ta.stoch(high, low, close, stochLengthK)
dValue      = ta.sma(kValue, stochLengthD)
stochSignal = ta.sma(dValue, stochSmooth)
[macdLine, signalLine, histLine] = ta.macd(close, macdFast, macdSlow, macdSignal)

// LTF trend filter
isBullTrend = close > ema200
isBearTrend = close < ema200

// -----------------------------------------------------
// Combine All Conditions
// -----------------------------------------------------
//
// We'll require that all filters line up for a long or short:
//  - HTF bias
//  - kill zone
//  - bullish/bearish FVG
//  - BOS up/down
//  - RSI, Stoch, MACD alignment
//  - Price above/below LTF 200 EMA

longCondition = isInKillZone                     // must be in session
 and isBullHTF                                   // HTF bias bullish
 and bullFVG                                     // bullish FVG
 and bosUp                                       // BOS up
 and (rsiValue > rsiUpper)                       // RSI > threshold
 and (kValue > dValue)                           // stoch K above D
 and (macdLine > signalLine)                     // MACD bullish
 and isBullTrend                                 // above LTF 200 EMA

shortCondition = isInKillZone                    // must be in session
 and isBearHTF                                   // HTF bias bearish
 and bearFVG                                     // bearish FVG
 and bosDown                                     // BOS down
 and (rsiValue < rsiLower)                       // RSI < threshold
 and (kValue < dValue)                           // stoch K below D
 and (macdLine < signalLine)                     // MACD bearish
 and isBearTrend                                 // below LTF 200 EMA

// -----------------------------------------------------
// Strategy Entries
// -----------------------------------------------------
if longCondition
    strategy.entry("Long Entry", strategy.long)

if shortCondition
    strategy.entry("Short Entry", strategy.short)

// -----------------------------------------------------
// Risk Management (Stop-Loss & Take-Profit)
// -----------------------------------------------------
if strategy.position_size > 0
    // Long position exit
    strategy.exit("Long Exit", stop  = strategy.position_avg_price * (1.0 - stopLossPerc/100.0), limit = strategy.position_avg_price * (1.0 + takeProfitPerc/100.0))

if strategy.position_size < 0
    // Short position exit
    strategy.exit("Short Exit",  stop  = strategy.position_avg_price * (1.0 + stopLossPerc/100.0), limit = strategy.position_avg_price * (1.0 - takeProfitPerc/100.0))

// -----------------------------------------------------
// Hide All Indicator Plots
// (We only show trade markers for entry & exit)
// -----------------------------------------------------
// Comment out or remove any plot() calls so chart stays clean.
//
// Example (commented out):
// plot(ema200, title="EMA 200", color=color.new(color.yellow, 0), linewidth=2)
// plot(rsiValue, title="RSI", color=color.new(color.blue, 0))
// plot(macdLine, title="MACD", color=color.new(color.teal, 0))
// plot(signalLine, title="Signal", color=color.new(color.purple, 0))