
Überblick
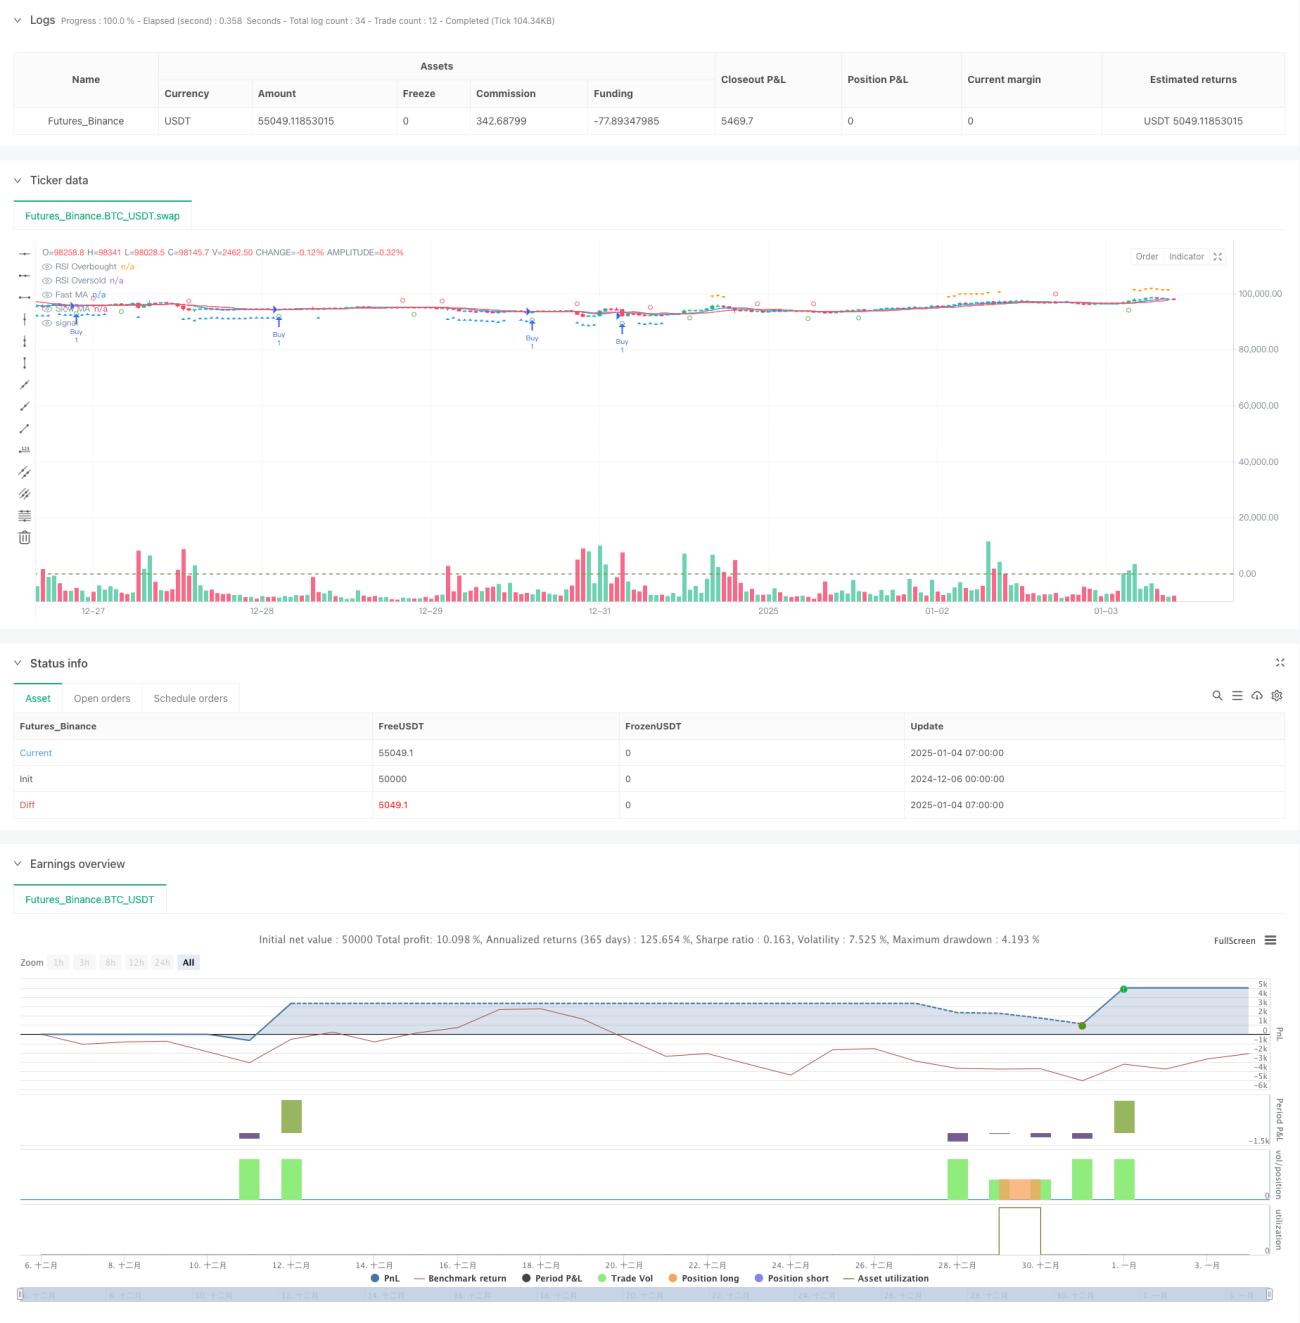
Bei dieser Strategie handelt es sich um ein quantitatives Handelssystem, das auf den Indikatoren „Moving Average Crossover“ und „RSI“ basiert und hauptsächlich für den Handel auf dem Optionsmarkt verwendet wird. Die Strategie verwendet die Kreuzungssignale der schnellen und langsamen gleitenden Durchschnitte, kombiniert mit den überkauften und überverkauften RSI-Levels, um den Zeitpunkt der Transaktionen zu bestimmen, während gleichzeitig Take-Profit und Stop-Loss zur Kontrolle der Risiken festgelegt werden. Diese Strategie eignet sich für den Handel in einem 5-Minuten-Zeitrahmen.
Strategieprinzip
Die Strategie verwendet zwei wichtige technische Indikatoren: Moving Average (MA) und Relative Strength Index (RSI). Speziell:
- Verwenden Sie einfache gleitende Durchschnitte (SMAs) für 7 und 13 Perioden, um Preistrends zu erfassen.
- Verwendung des 17-Perioden-RSI-Indikators zur Identifizierung überkaufter und überverkaufter Bedingungen
- Wenn der schnelle gleitende Durchschnitt den langsamen gleitenden Durchschnitt nach oben kreuzt und der RSI unter 43 liegt, generiert das System ein Long-Signal.
- Wenn der schnelle gleitende Durchschnitt den langsamen gleitenden Durchschnitt nach unten kreuzt und der RSI über 64 liegt, generiert das System ein kurzes Signal
- Legen Sie einen Take-Profit von 4 % und einen Stop-Loss von 0,5 % fest, um das Risiko zu steuern
Strategische Vorteile
- Mehrfachbestätigungsmechanismus: Kombinieren Sie gleitende Durchschnittskreuzungen und RSI-Indikatoren, um zuverlässigere Handelssignale bereitzustellen
- Perfektes Risikomanagement: Legen Sie feste Prozentsätze für Stop-Profit und Stop-Loss fest, um Risiken effektiv zu kontrollieren
- Hohe Anpassungsfähigkeit: Parameter können flexibel an unterschiedliche Marktbedingungen angepasst werden
- Visualisierungsunterstützung: Die Strategie bietet klare grafische Anweisungen, um Händlern das Verständnis der Marktbedingungen zu erleichtern
- Klare Betriebsregeln: klare Ein- und Ausstiegsbedingungen, Reduzierung von Störungen durch subjektive Beurteilungen
Strategisches Risiko
- Risiko eines volatilen Marktes: In einem seitwärts gerichteten und volatilen Markt können häufig falsche Signale auftreten
- Slippage-Risiko: Wenn der Optionsmarkt illiquide ist, kann es zu großen Slippage-Risiken kommen.
- Parametersensitivität: Die Wirkung der Strategie ist empfindlich gegenüber den Parametereinstellungen und muss kontinuierlich optimiert werden.
- Abhängigkeit vom Marktumfeld: In einem volatilen Marktumfeld kann der Stop-Loss möglicherweise nicht rechtzeitig genug erfolgen
- Systemisches Risiko: Wenn Marktlücken oder große Ereignisse auftreten, kann der Stop-Loss versagen
Richtung der Strategieoptimierung
- Einführung von Volatilitätsindikatoren: Erwägen Sie die Einbeziehung von ATR oder Bollinger Bands in Ihr Entscheidungssystem
- Optimieren Sie die Parameteranpassung: Entwickeln Sie einen dynamischen Parameteranpassungsmechanismus basierend auf den Marktbedingungen
- Erhöhen Sie die Filterung der Marktstimmung: Kombinieren Sie Handelsvolumen und andere Indikatoren, um falsche Signale herauszufiltern
- Verbessern Sie den Stop-Loss-Mechanismus: Erwägen Sie die Einführung eines Trailing-Stop-Loss, um die Effizienz des Risikomanagements zu verbessern
- Zeitfilter hinzufügen: Fügen Sie ein Handelszeitfensterlimit hinzu, um ineffizienten Handel zu vermeiden
Zusammenfassen
Diese Strategie erstellt durch die Kombination der gleitenden Durchschnittskreuzung und der RSI-Indikatoren ein relativ vollständiges Handelssystem. Die Vorteile der Strategie liegen in der mehrfachen Signalbestätigung und dem perfekten Risikomanagement, allerdings muss auch auf die Auswirkungen des Marktumfelds auf die Performance der Strategie geachtet werden. Durch kontinuierliche Optimierung und Verbesserung soll diese Strategie eine stabile Performance auf dem Optionsmarkt erzielen. Händlern wird empfohlen, vor der Echtzeitnutzung ausreichende Backtests und Parameteroptimierungen durchzuführen.
- 1