Langfristige Trend-SMA-Gleitende-Durchschnitt-Crossover-Quantitative-Strategie

Überblick
Bei der Strategie handelt es sich um ein quantitatives Handelssystem, das auf mehrperiodischen SMA-Crossover-Signalen (Simple Moving Average) basiert. Der Handel erfolgt in erster Linie durch die Identifizierung kurzfristiger Rückzugsmöglichkeiten innerhalb eines langfristigen Aufwärtstrends. Die Strategie verwendet SMA-Indikatoren mit fünf Perioden von 5 Tagen, 10 Tagen, 20 Tagen, 60 Tagen und 120 Tagen, um Markttrends und Handelsmöglichkeiten anhand der Positionsbeziehungen und Crossover-Signale der gleitenden Durchschnitte zu beurteilen.
Strategieprinzip
Die Kernlogik der Strategie umfasst die folgenden Schlüsselelemente:
- Der langfristige Trend kann anhand der relativen Positionsbeziehung zwischen SMA20 und SMA60 beurteilt werden. Wenn SMA20 über SMA60 liegt, wird bestätigt, dass sich der Markt in einem Aufwärtstrend befindet.
- Unter der Voraussetzung der Bestätigung des langfristigen Aufwärtstrends wird ein Kaufsignal ausgelöst, wenn der kurzfristige SMA5 von unter SMA20 nach oben zurückprallt. Dies deutet darauf hin, dass sich der Markt nach einem kurzfristigen Rückgang in einem Aufwärtstrend erholt.
- Wenn SMA20 SMA5 kreuzt, wird ein Schlusssignal ausgelöst. Dies deutet darauf hin, dass die kurzfristige Aufwärtsdynamik nachgelassen hat und möglicherweise eine Anpassungsphase eintreten wird.
- Die Strategie beinhaltet außerdem eine Zeitfilterfunktion, welche den Zeitbereich des Backtests einschränken und die Flexibilität der Strategie erhöhen kann.
Strategische Vorteile
- Die Strategielogik ist klar und einfach, leicht zu verstehen und umzusetzen und beinhaltet keine komplexen Berechnungsprozesse.
- Durch die koordinierte Verwendung gleitender Durchschnitte mehrerer Perioden können wir Marktrauschen wirksam herausfiltern und die Zuverlässigkeit von Handelssignalen verbessern.
- Die Strategie konzentriert sich auf Rückzugsmöglichkeiten in Trendmärkten, was dem Kernkonzept des „Trendhandels“ entspricht.
- Die Verwendung von SMA anstelle von EMA verringert die Empfindlichkeit gegenüber Preisänderungen und reduziert falsche Signale.
- Die Ein- und Ausstiegslogik ist klar, was die Ausführung und Risikokontrolle erleichtert.
Strategisches Risiko
- Das gleitende Durchschnittssystem weist Verzögerungen auf, die zu nicht optimalen Ein- und Ausstiegszeitpunkten führen können.
- In einem volatilen Markt können häufige Überkreuzungen des gleitenden Durchschnitts zu viele falsche Signale erzeugen.
- Der Strategie fehlt ein Volatilitätsfiltermechanismus, und in Zeiten hoher Volatilität kann es zu größeren Drawdown-Risiken kommen.
- Ohne die Zusammenarbeit mit anderen technischen Indikatoren wie dem Handelsvolumen zu berücksichtigen, muss die Zuverlässigkeit des Signals verbessert werden.
- Feste gleitende Durchschnittsparameter sind möglicherweise nicht für alle Marktumgebungen geeignet.
Richtung der Strategieoptimierung
- Führen Sie den ATR-Indikator zur Volatilitätsfilterung ein und vermeiden Sie den Handel bei zu hoher Volatilität.
- Fügen Sie einen Volumenbestätigungsmechanismus hinzu, um die Zuverlässigkeit von Handelssignalen zu verbessern.
- Entwickeln Sie einen adaptiven Mechanismus für gleitende Durchschnittszyklen, um eine bessere Anpassung der Strategie an unterschiedliche Marktumgebungen zu ermöglichen.
- Fügen Sie einen Trendstärkefilter wie den ADX-Indikator hinzu, um den Handel mit starken Trends sicherzustellen.
- Verbessern Sie den Stop-Loss-Mechanismus, beispielsweise durch das Hinzufügen eines Trailing-Stops, um die Risiken besser zu kontrollieren.
Zusammenfassen
Diese Strategie verwendet gleitende SMA-Durchschnitte über mehrere Perioden, um ein Handelssystem aufzubauen, das sich auf die Nutzung von Rückzugsmöglichkeiten in langfristigen Aufwärtstrends konzentriert. Der Strategieentwurf ist prägnant und praxisnah, mit guter Verständlichkeit und Umsetzbarkeit. Durch die Einführung von Optimierungsmaßnahmen wie Volatilitätsfilterung und Volumenbestätigung sollen die Robustheit und Zuverlässigkeit der Strategie weiter verbessert werden.
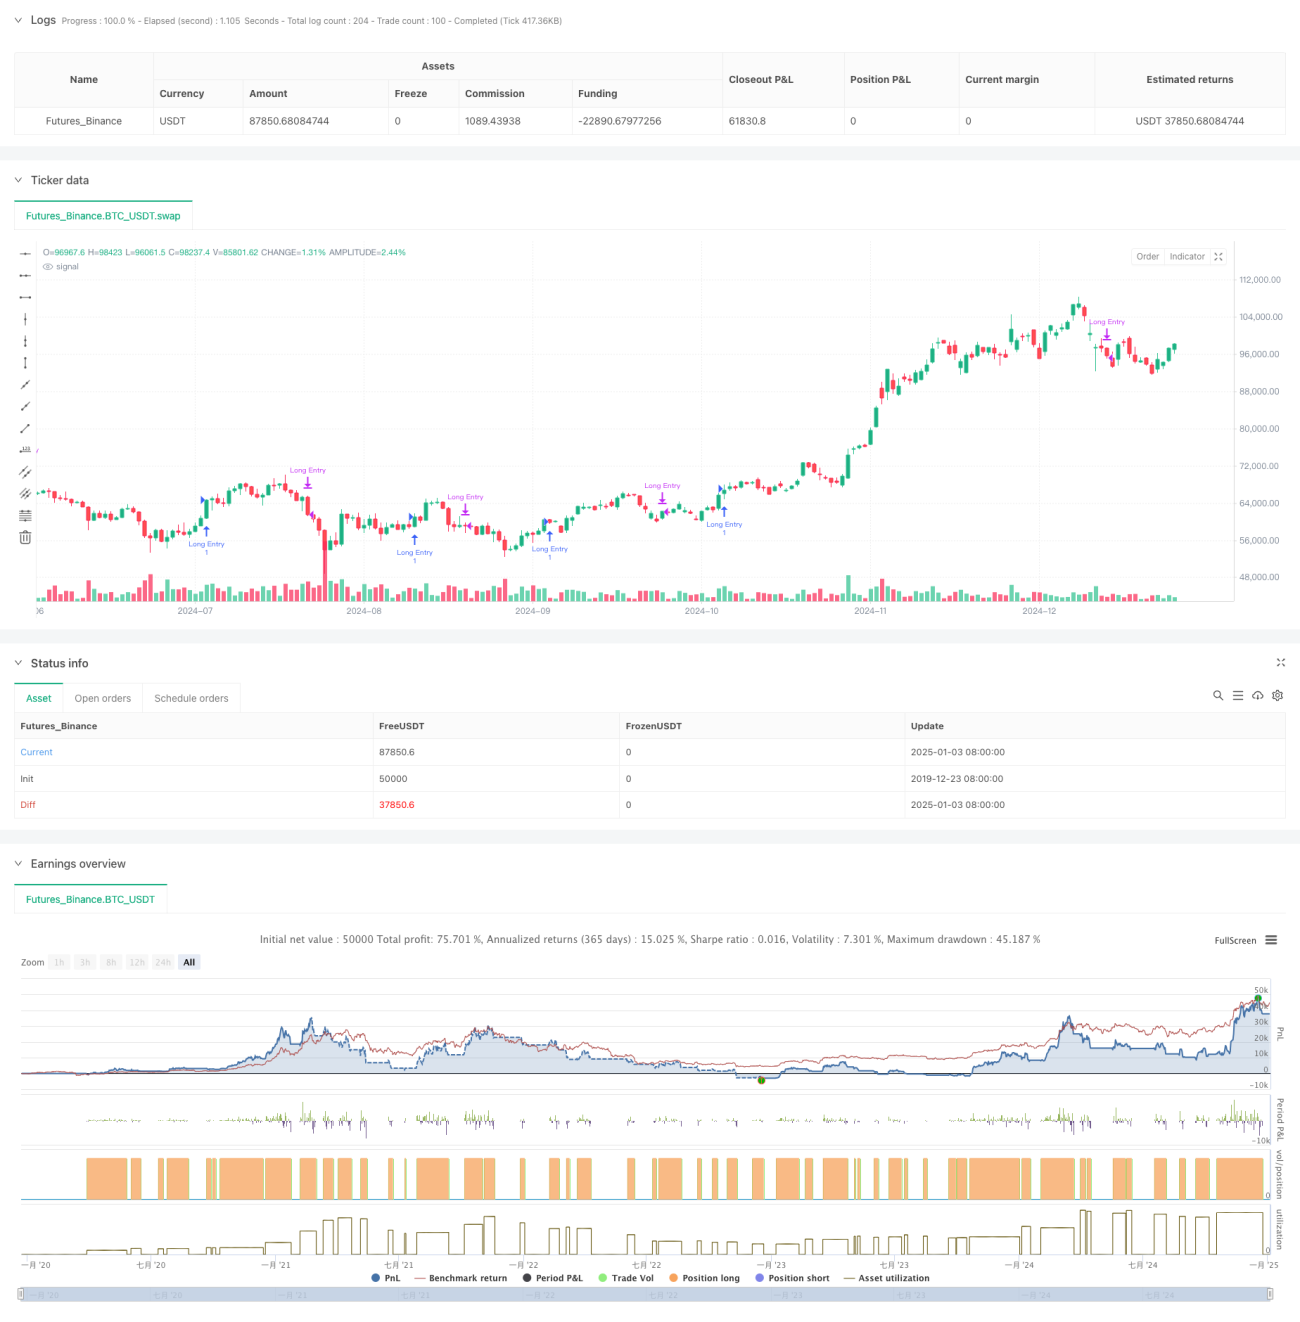
/*backtest
start: 2019-12-23 08:00:00
end: 2025-01-04 08:00:00
period: 1d
basePeriod: 1d
exchanges: [{"eid":"Futures_Binance","currency":"BTC_USDT"}]
*/

//@version=6
strategy("Long-Term Growing Stock Strategy", overlay=true)
// Date Range
// STEP 1. Create inputs that configure the backtest's date range- 1