Hochfrequente Preis- und Volumentrendverfolgung und adaptive Strategie zur Volumenanalyse

Überblick
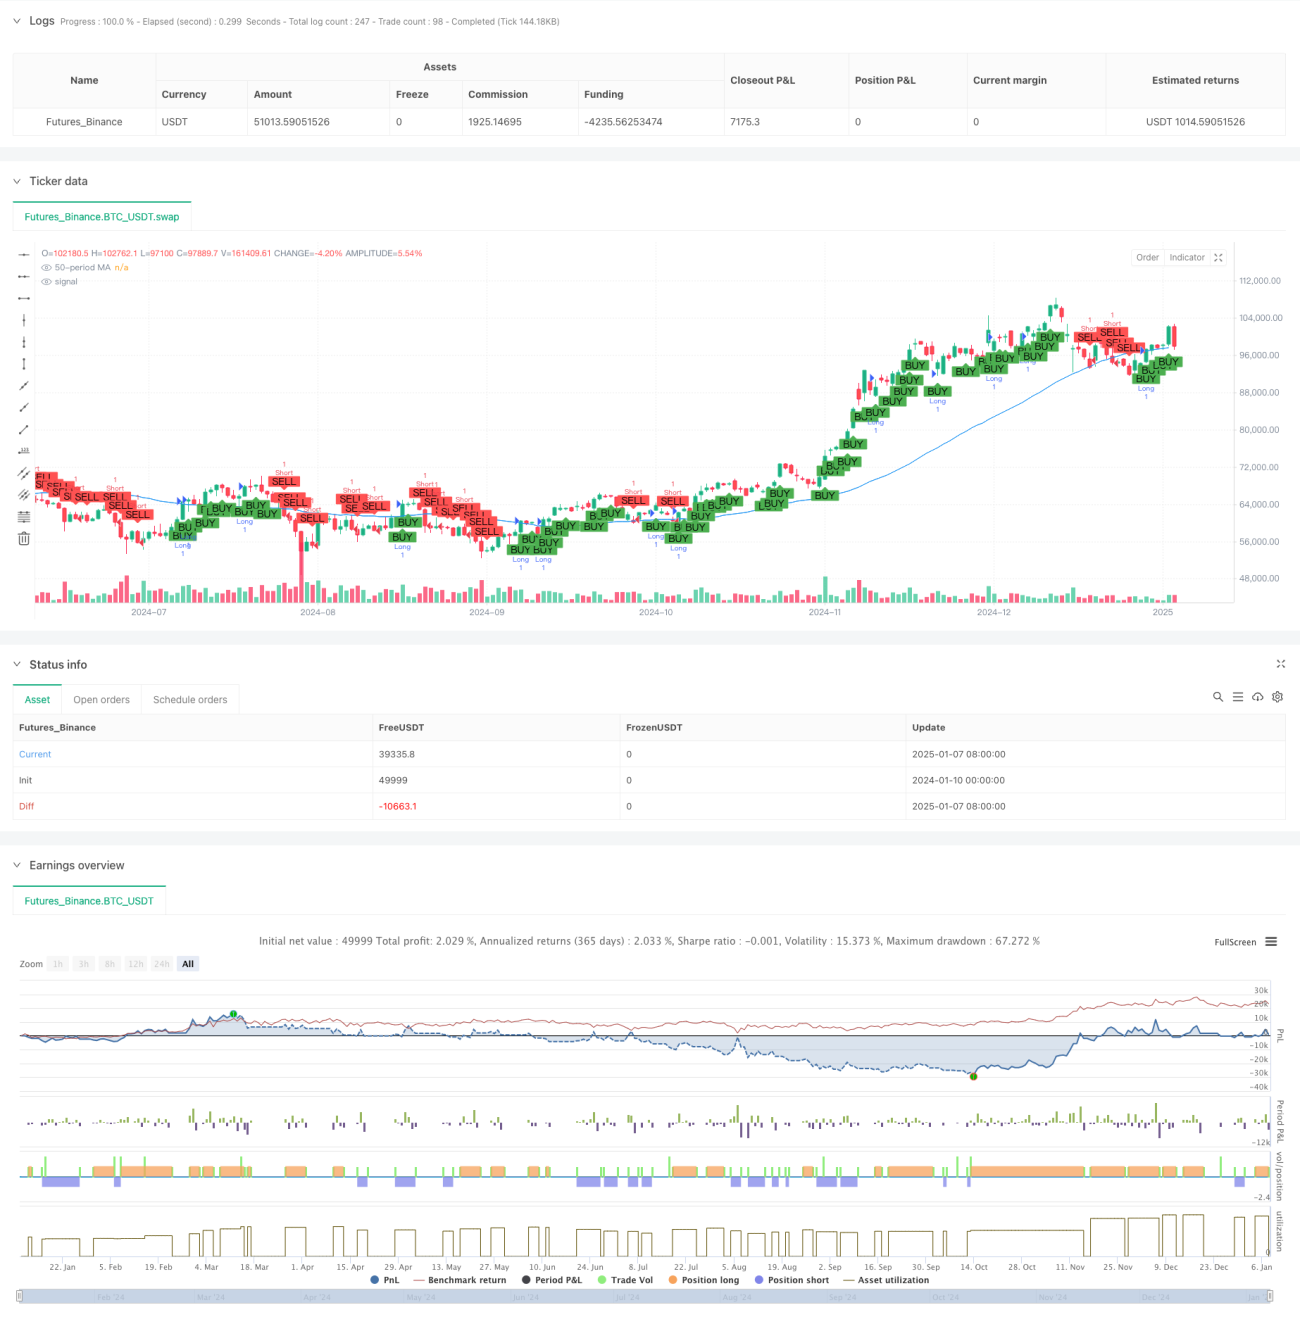
Bei der Strategie handelt es sich um ein automatisiertes Handelssystem mit einem 5-Minuten-Zeitrahmen, das gleitende Durchschnittstrendfolgeverfahren und Methoden der Volumenanalyse kombiniert. Die Strategie verwendet einen einfachen gleitenden Durchschnitt (SMA) über 50 Perioden, um Markttrends zu bestimmen, und führt eine Volumenanalyse ein, um die Gültigkeit von Handelssignalen zu überprüfen. Das System verwendet feste Stop-Loss- und Gewinnziele, um einen vollständig automatisierten Handel zu ermöglichen.
Strategieprinzip
Die Kernlogik der Strategie umfasst die folgenden Schlüsselkomponenten:
- Trenderkennung: Verwenden Sie den 50-Perioden-SMA, um die Marktrichtung zu bestimmen. Wenn der Schlusskurs höher als der gleitende Durchschnitt ist, wird dies als Aufwärtstrend angesehen, andernfalls als Abwärtstrend. Gleichzeitig wird der Preisverlauf der letzten 30 Minuten (6 K-Linien) zur Trendbestätigung kombiniert.
- Volumenanalyse: Berechnen Sie das Kauf- und Verkaufsvolumen basierend auf Preisschwankungen und teilen Sie das Volumen innerhalb jeder K-Linie entsprechend der Schlusskursposition in Kauf- und Verkaufsvolumen auf.
- Handelssignalgenerierung: Bei einem Aufwärtstrend wird ein Long-Signal generiert, wenn das Kaufvolumen größer ist als das Verkaufsvolumen; bei einem Abwärtstrend wird ein Short-Signal generiert, wenn das Verkaufsvolumen größer ist als das Kaufvolumen.
- Risikokontrolle: Verwenden Sie einen Stop-Loss von 3 % und ein Gewinnziel von 29 %, um das Risiko-Ertrags-Verhältnis jedes Handels zu steuern.
Strategische Vorteile
- Mehrdimensionale Trendbestätigung: Durch die Kombination des gleitenden Durchschnitts und kurzfristiger Preistrends zur doppelten Bestätigung des Trends wird die Genauigkeit der Trendbeurteilung verbessert.
- Volumenüberprüfung: Führen Sie die Volumenanalyse als Handelssignalfilter ein, um falsche Ausbrüche in einer Umgebung mit geringem Volumen zu vermeiden.
- Perfektes Risikomanagement: Legen Sie klare Stop-Loss- und Gewinnziele fest, um das Risiko einer einzelnen Transaktion effektiv zu kontrollieren.
- Starke Anpassungsfähigkeit: Die Strategie kann die Transaktionsrichtung automatisch entsprechend der Marktlage anpassen und sich an unterschiedliche Marktumgebungen anpassen.
Strategisches Risiko
- Risiko eines volatilen Marktes: In einem seitwärts gerichteten und volatilen Markt kann es häufig zu falschen Ausbruchssignalen kommen, die zu kontinuierlichen Stop-Loss-Aufträgen führen.
- Slippage-Risiko: Beim Hochfrequenzhandel kann es zu großem Slippage kommen, der sich auf den tatsächlichen Ausführungseffekt auswirken kann.
- Parametersensitivität: Die Wirkung der Strategie ist empfindlich gegenüber Parametern wie dem gleitenden Durchschnittszeitraum und dem Berechnungszeitraum des Handelsvolumens.
- Abhängigkeit vom Marktumfeld: Die Strategie funktioniert gut in einem Markt mit klarem Trend, kann aber in Trendübergangsphasen große Verluste erleiden.
Richtung der Strategieoptimierung
- Dynamische Parameteroptimierung: Ein adaptiver Parametermechanismus kann eingeführt werden, um den gleitenden Durchschnittszeitraum und den Berechnungszeitraum des Handelsvolumens dynamisch entsprechend der Marktvolatilität anzupassen.
- Erhöhen Sie die Filterung des Marktumfelds: Fügen Sie Volatilitätsindikatoren oder Trendstärkeindikatoren hinzu, um den Handel bei ungeeigneten Marktbedingungen automatisch zu stoppen.
- Verbesserung des Stop-Loss-Mechanismus: Dynamische Stop-Loss-Methoden wie Trailing Stop-Loss oder ATR-basierte Stop-Loss-Methoden können zur Erhöhung der Flexibilität der Risikokontrolle eingesetzt werden.
- Optimieren Sie die Logik der Signalgenerierung: Erwägen Sie das Hinzufügen weiterer technischer Indikatoren zur Kreuzvalidierung, um die Signalzuverlässigkeit zu verbessern.
Zusammenfassen
Diese Strategie erstellt durch die Kombination von Trendverfolgung und Volumenanalyse ein komplettes Hochfrequenzhandelssystem. Die Hauptvorteile der Strategie liegen in ihrem mehrdimensionalen Signalbestätigungsmechanismus und ihrem perfekten Risikokontrollsystem. Obwohl einige inhärente Risiken bestehen, können die Stabilität und Anpassungsfähigkeit der Strategie durch die vorgeschlagenen Optimierungsrichtungen weiter verbessert werden. Die Strategie eignet sich besonders für das Agieren in einem Marktumfeld mit klaren Trends und verspricht durch sinnvolle Parameteroptimierung und Risikomanagement stabile Handelsergebnisse.
/*backtest
start: 2024-01-10 00:00:00
end: 2025-01-08 08:00:00
period: 1d
basePeriod: 1d
exchanges: [{"eid":"Futures_Binance","currency":"BTC_USDT","balance":49999}]
*/

// This Pine Script™ code is subject to the terms of the Mozilla Public License 2.0 at https://mozilla.org/MPL/2.0/
// © Jerryorange

//@version=6- 1