Dynamisches neuronales Netzwerk RSI Trendfolge-Handelsstrategie

Überblick
Bei dieser Strategie handelt es sich um ein quantitatives Handelssystem, das auf gleitendem Durchschnitt, RSI-Indikator und Trailing-Stop-Loss basiert. Es kombiniert Trendverfolgung und Momentumindikatoren in der technischen Analyse, um durch die Festlegung strenger Ein- und Ausstiegsbedingungen risikokontrollierte Transaktionen zu erreichen. Die Kernlogik der Strategie besteht darin, nach überverkauften Gelegenheiten für den Markteinstieg bei einem Aufwärtstrend zu suchen und Trailing-Stop-Losses zu verwenden, um Gewinne zu schützen.
Strategieprinzip
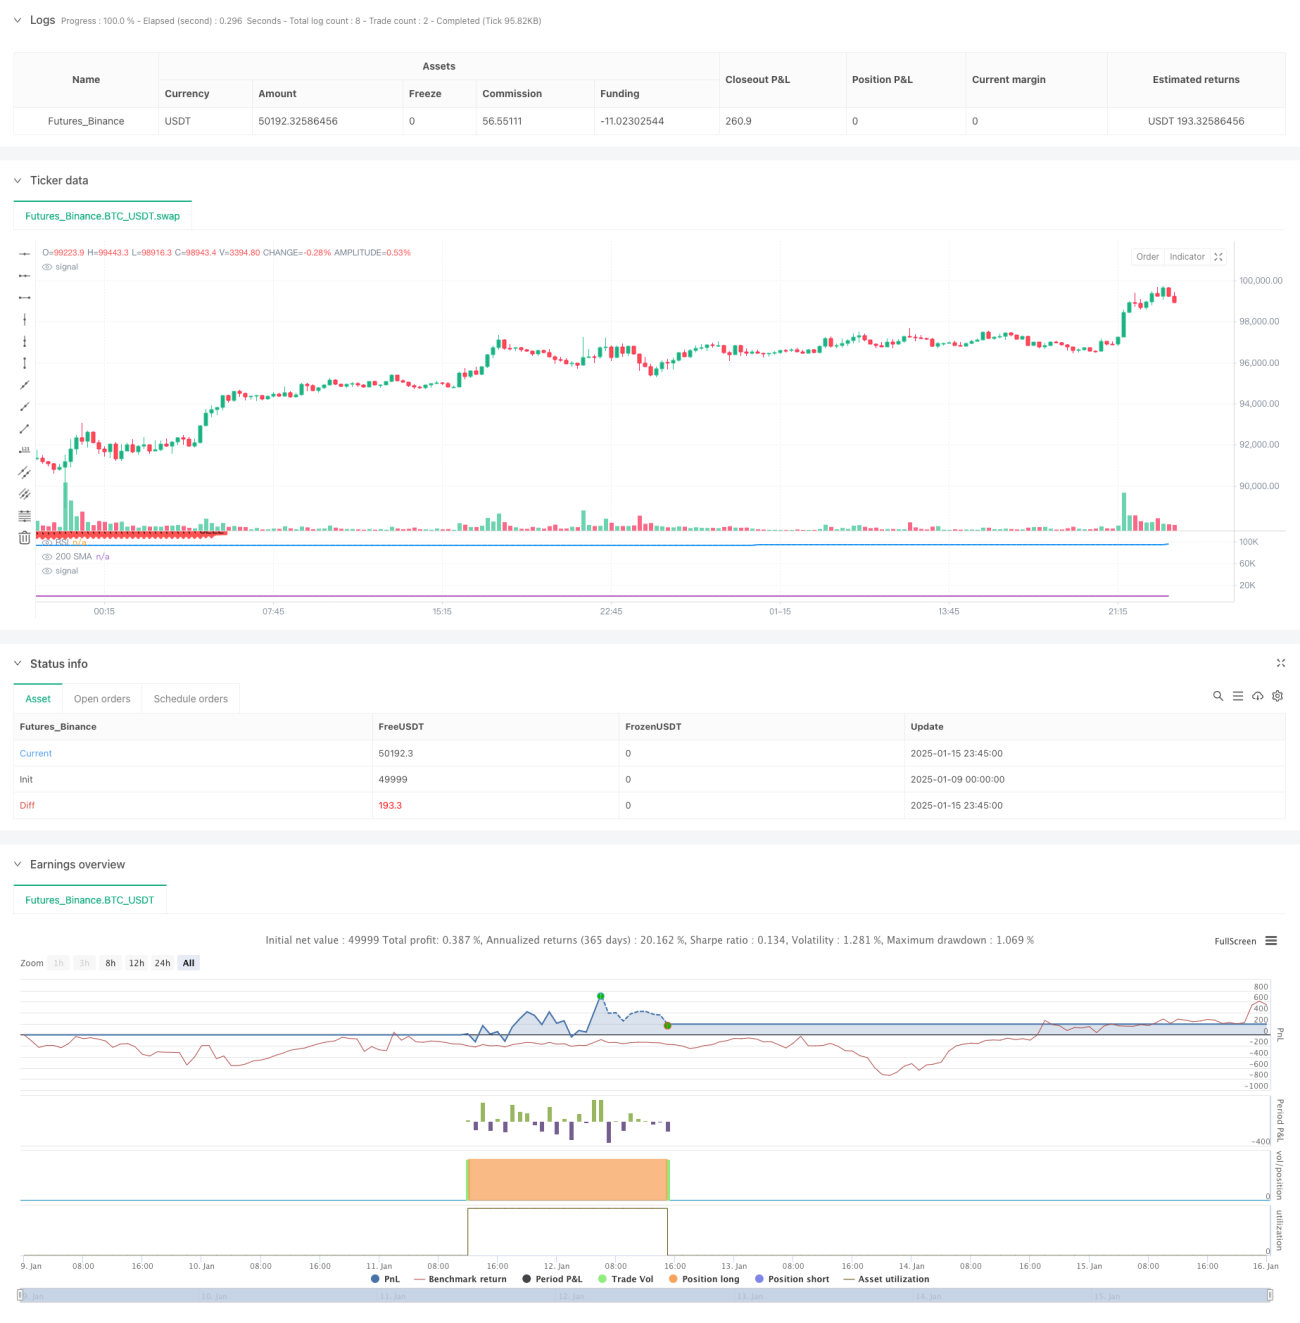
Die Strategie verwendet den 200-Tage-SMA (Simple Moving Average) als Grundlage zur Trendbeurteilung und kombiniert ihn mit dem Relative Strength Index (RSI), um Handelssignale zu generieren. Speziell:
- Verwenden Sie den 200-Tage-Durchschnitt, um den allgemeinen Trend zu bestimmen, und ziehen Sie eine Long-Position nur in Erwägung, wenn der Preis über dem gleitenden Durchschnitt liegt.
- Wenn der RSI unter den voreingestellten Schwellenwert (Standard 40) fällt, wird dies als überverkauftes Signal betrachtet.
- Wenn beide der oben genannten Bedingungen erfüllt sind und die Wartezeit (Standard 10 Tage) seit der Schließung der letzten Position abgelaufen ist, wird ein Long-Signal ausgelöst.
- Schützen Sie Gewinne dynamisch während der Positionshaltung durch Trailing Stop Loss (Standard 5 %)
- Wenn der Preis unter den Trailing-Stop-Loss-Preis oder unter den 200-Tage-Durchschnitt fällt, schließen Sie die Position
Strategische Vorteile
- Kombinieren Sie Trend- und Momentum-Doppelfilterung, um die Handelsgenauigkeit zu verbessern
- Durch die Verwendung des Tracking-Stop-Loss-Mechanismus können Gewinne effektiv gesichert werden
- Legen Sie Transaktionsintervalle fest, um häufige Transaktionen zu vermeiden
- Die Parameter sind hochgradig anpassbar, um sich an unterschiedliche Marktumgebungen anzupassen
- Die Transaktionslogik ist klar, leicht zu verstehen und auszuführen
- Einfache Kalkulation und hohe Betriebseffizienz
Strategisches Risiko
- Verzögerungen bei gleitenden Durchschnittswerten können zu verzögerten Ein- und Ausstiegssignalen führen
- Der RSI-Indikator kann in einem volatilen Markt falsche Signale erzeugen
- Trailing Stops mit festem Prozentsatz sind möglicherweise nicht für alle Marktbedingungen geeignet.
- Parameteroptimierung kann zu Überanpassung führen
- In volatilen Märkten können große Einbußen auftreten
Richtung der Strategieoptimierung
- Einführung des volatilitätsadaptiven Trailing-Stop-Prozentsatzes
- Lautstärkeanzeige als Zusatzbestätigung hinzufügen
- Verwenden Sie einen exponentiellen gleitenden Durchschnitt anstelle eines einfachen gleitenden Durchschnitts, um die Empfindlichkeit zu verbessern
- Fügen Sie Marktstimmungsindikatoren hinzu, um Handelsmöglichkeiten zu optimieren
- Entwickeln Sie einen dynamischen Mechanismus zur Parameteroptimierung
- Bestätigungsmechanismus für mehrperiodische Strategien hinzugefügt
Zusammenfassen
Dies ist eine quantitative Handelsstrategie mit einer vollständigen Struktur und klarer Logik. Es kombiniert mehrere technische Indikatoren, um stabile Renditen bei gleichzeitiger Kontrolle der Risiken zu erzielen. Obwohl es Raum für Optimierung gibt, ist das grundlegende Framework gut praktikabel und skalierbar. Die Strategie eignet sich für mittel- und langfristige Anleger und verfügt über eine gute Anpassungsfähigkeit an unterschiedliche Marktumgebungen.
- 1