Mehrfache gleitende Durchschnittstrendverfolgung und dynamische Volatilitätsfilterstrategie

Überblick
Die Strategie ist ein intelligentes Handelssystem, das Trendfolge und Volatilitätsfilterung kombiniert. Es identifiziert Markttrends durch den Exponential Moving Average (EMA), verwendet den True Range (TR) und dynamische Volatilitätsfilter, um den Einstiegszeitpunkt zu bestimmen, und verwaltet das Risiko mit einem dynamischen Stop-Profit- und Stop-Loss-Mechanismus basierend auf der Volatilität. Die Strategie unterstützt zwei Handelsmodi: Scalp und Swing, die je nach Marktumgebung und Handelsstil flexibel umgeschaltet werden können.
Strategieprinzip
Die Kernlogik der Strategie umfasst die folgenden Schlüsselkomponenten:
- Trenderkennung: Verwenden Sie den 50-Perioden-EMA als Trendfilter und gehen Sie nur dann long, wenn der Preis über dem EMA liegt, und gehen Sie short, wenn er unter dem EMA liegt.
- Volatilitätsfilterung: Berechnet den EMA des True Range (TR) und verwendet einen einstellbaren Filterfaktor (Standard 1,5), um Marktrauschen herauszufiltern.
- Einstiegsbedingungen: Kombiniert mit der morphologischen Analyse von drei aufeinanderfolgenden K-Linien muss die Preisbewegung kontinuierlich und beschleunigt sein.
- Take Profit und Stop Loss: Im Kurzzeitmodus werden sie auf Grundlage des aktuellen TR festgelegt, im Bandmodus auf Grundlage der vorherigen Hoch- und Tiefpunkte, um ein dynamisches Risikomanagement zu erreichen.
Strategische Vorteile
- Starke Anpassungsfähigkeit: Durch die Kombination aus dynamischer Volatilitätsfilterung und Trendverfolgung kann es sich an unterschiedliche Marktumgebungen anpassen.
- Perfektes Risikomanagement: Bereitstellung dynamischer Stop-Profit- und Stop-Loss-Mechanismen für zwei Handelsmodi, die je nach Markteigenschaften flexibel ausgewählt werden können.
- Gute Parameteranpassbarkeit: Schlüsselparameter wie Filterkoeffizient, Trendzyklus usw. können entsprechend den Eigenschaften der Handelsprodukte optimiert werden.
- Guter Visualisierungseffekt: Bietet klare Kauf- und Verkaufssignalmarkierungen und Stop-Profit- und Stop-Loss-Positionsanzeigen, um die Transaktionsüberwachung zu erleichtern.
Strategisches Risiko
- Trendumkehrrisiko: An Trendwendepunkten kann es zu aufeinanderfolgenden Stopps kommen.
- Risiko falscher Ausbrüche: Bei plötzlich steigender Volatilität können falsche Signale ausgelöst werden.
- Parameterempfindlichkeit: Eine falsche Einstellung der Filterkoeffizienten kann zu einem zu starken oder zu schwachen Signal führen.
- Auswirkungen von Slippage: In einem schnellen Markt kann es zu großen Slippages kommen, die die Leistung Ihrer Strategie beeinträchtigen können.
Richtung der Strategieoptimierung
- Filterung der Trendstärke hinzufügen: Indikatoren wie ADX können eingeführt werden, um die Trendstärke zu bewerten und Trendverfolgungseffekte zu verbessern.
- Take-Profit und Stop-Loss optimieren: Erwägen Sie die Einführung eines gleitenden Stop-Loss, um mehr Gewinne zu sichern.
- Verbesserung des Swing-Trading-Modells: Es können weitere Swing-Trading-spezifische Beurteilungsbedingungen hinzugefügt werden, um die mittel- und langfristigen Haltemöglichkeiten zu verbessern.
- Volumenanalyse hinzufügen: Kombinieren Sie Volumenänderungen, um die Gültigkeit des Durchbruchs zu bestätigen.
Zusammenfassen
Diese Strategie konstruiert ein komplettes Handelssystem durch die organische Kombination von Trendverfolgung, Volatilitätsfilterung und dynamischem Risikomanagement. Der Vorteil der Strategie liegt darin, dass sie höchst anpassungsfähig und risikokontrolliert ist und gleichzeitig viel Spielraum für Optimierungen bietet. Durch sinnvolles Festlegen der Parameter und Auswählen geeigneter Handelsmodi kann die Strategie in unterschiedlichen Marktumgebungen eine stabile Leistung aufrechterhalten. Es wird Händlern empfohlen, vor der tatsächlichen Verwendung ausreichende Backtests und Parameteroptimierungen durchzuführen und entsprechende Anpassungen basierend auf den Merkmalen bestimmter Handelsprodukte vorzunehmen.
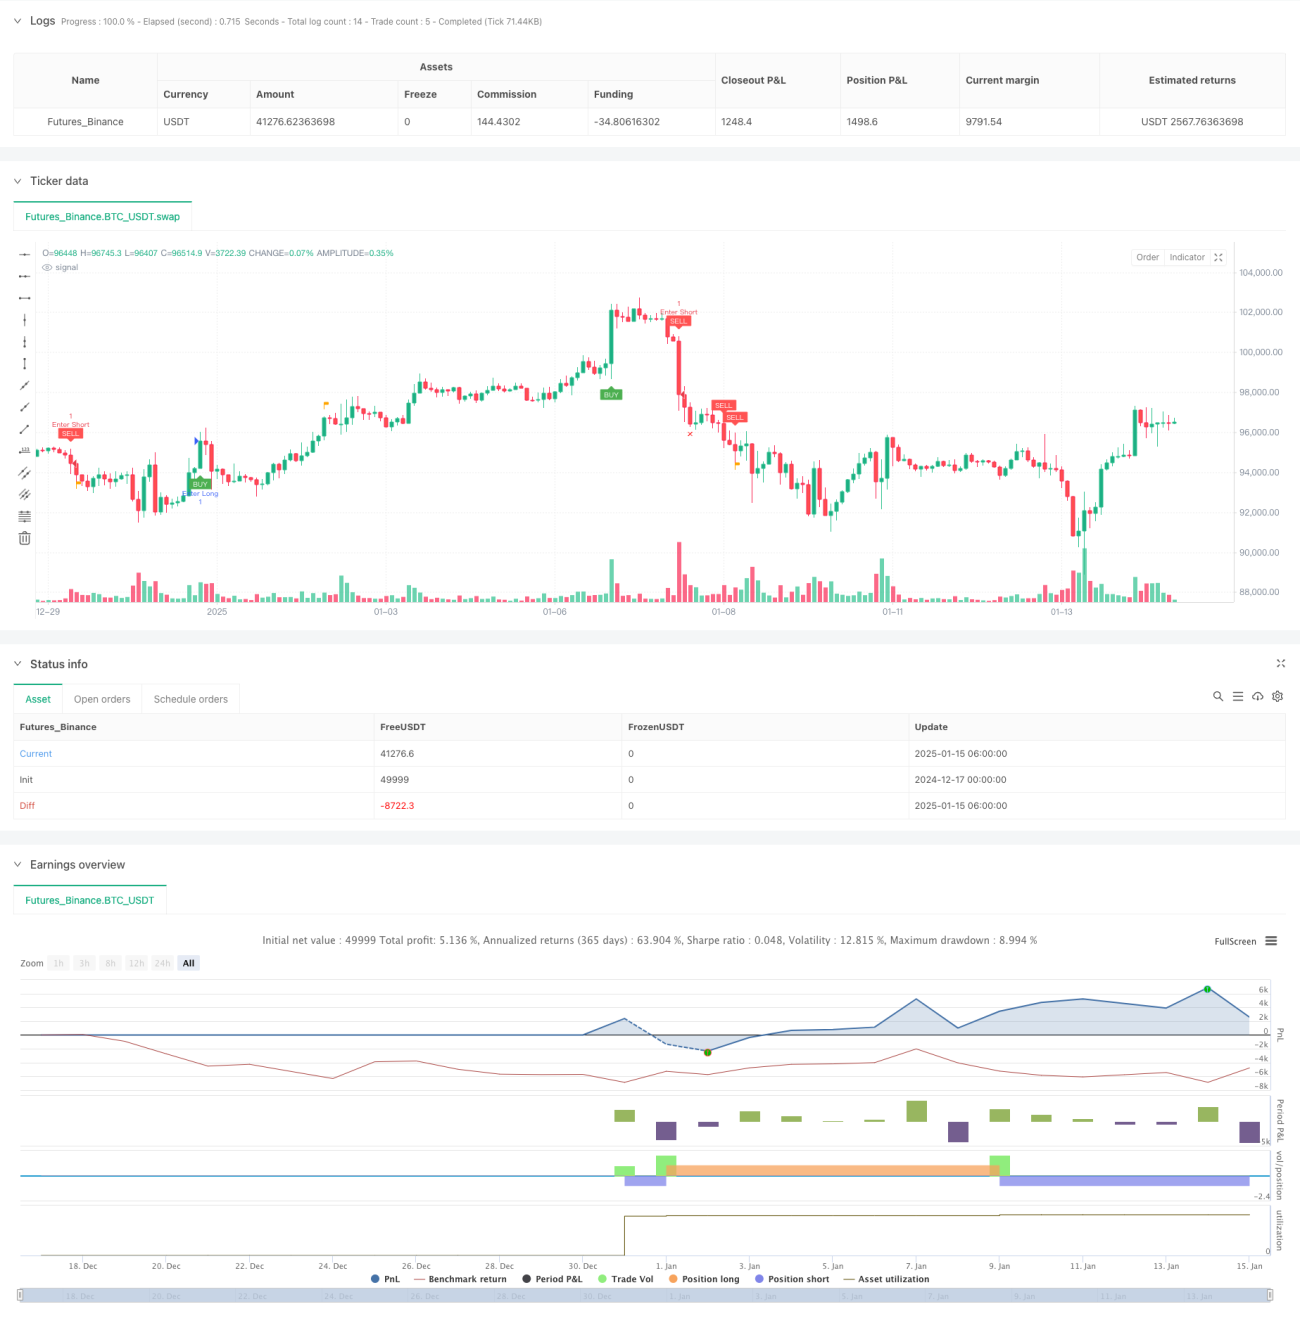
/*backtest
start: 2024-12-17 00:00:00
end: 2025-01-15 08:00:00
period: 2h
basePeriod: 2h
exchanges: [{"eid":"Futures_Binance","currency":"BTC_USDT","balance":49999}]
*/

// This Pine Script™ code is subject to the terms of the Mozilla Public License 2.0 at https://mozilla.org/MPL/2.0/
// © Creativ3mindz

//@version=5- 1