Mehrere technische Indikatoren kreuzen die Momentum-Trendfolgestrategie

Überblick
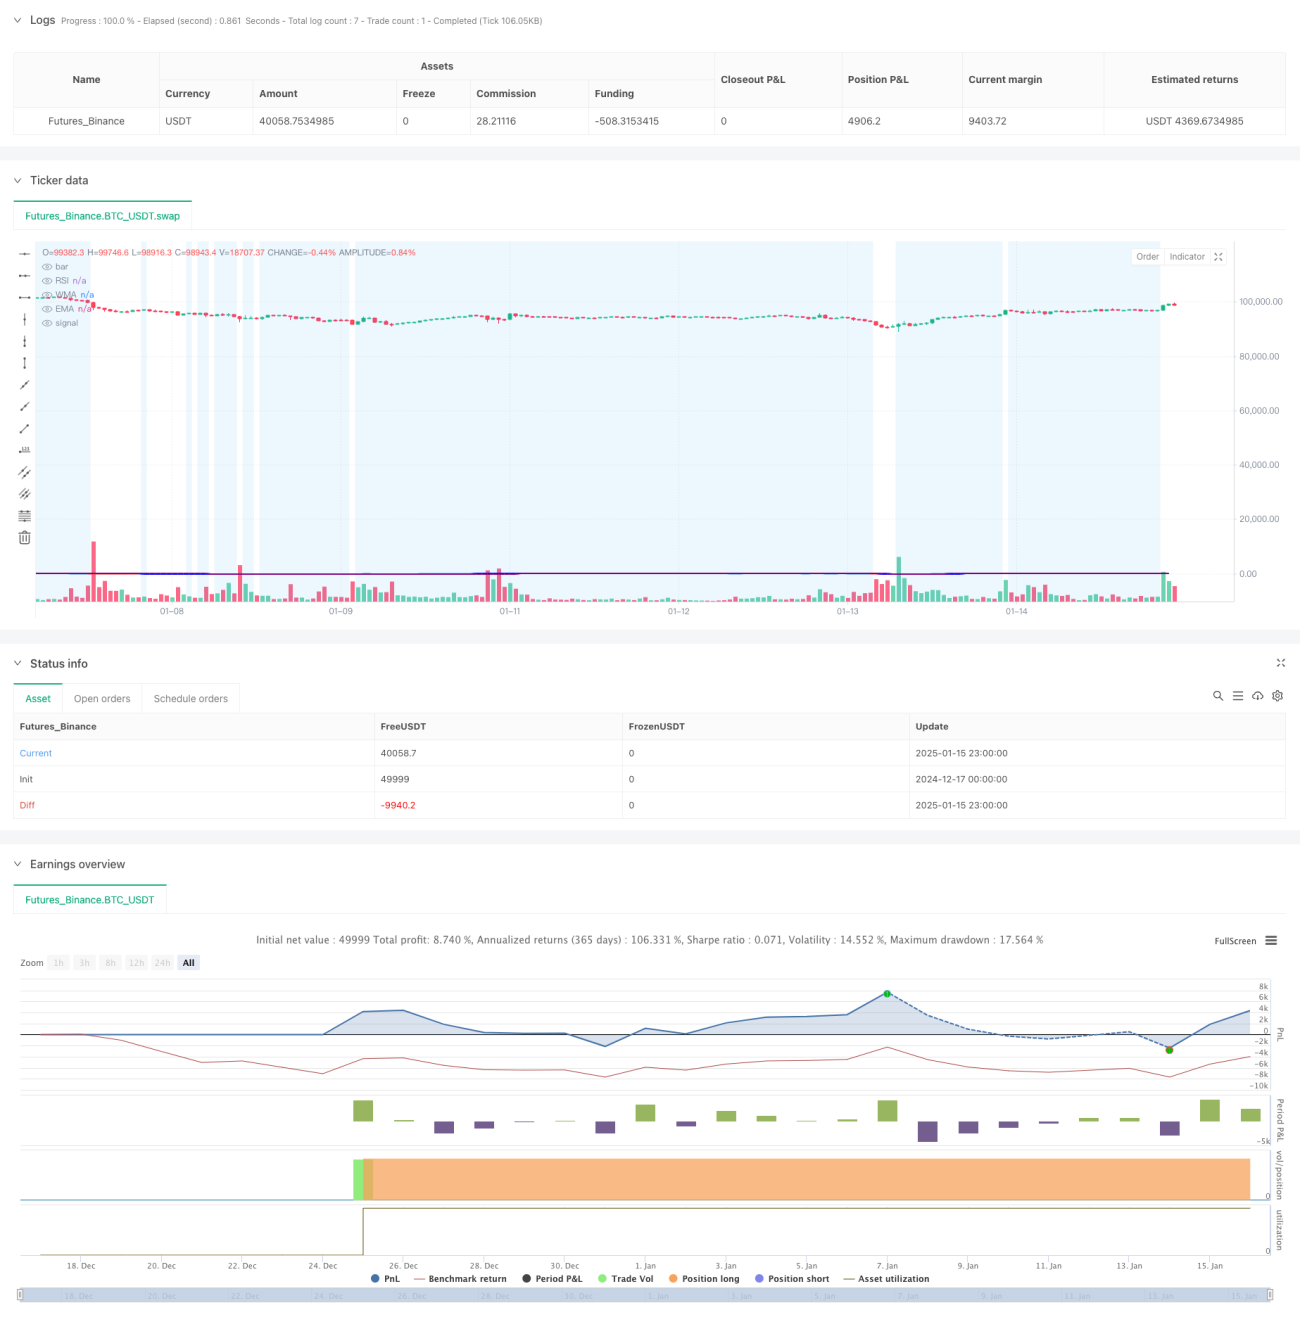
Die Strategie ist ein trendfolgendes Handelssystem, das den Relative Strength Index (RSI), den Weighted Moving Average (WMA) und den Exponential Moving Average (EMA) kombiniert. Die Strategie verwendet mehrere koordinierte technische Indikatoren, um Änderungen der Marktdynamik an Trendwendepunkten zu erfassen und so Handelssignale zu generieren. Das System verwendet die Kreuzung von WMA und EMA, um die Trendrichtung zu bestätigen, und kombiniert den RSI-Indikator, um den Marktstatus zu filtern und so die Genauigkeit der Transaktionen zu verbessern.
Strategieprinzip
Die Kernlogik der Strategie basiert auf den folgenden Schlüsselelementen:
- Der RSI-Indikator wird unter Verwendung eines Zeitraums von 14 Perioden berechnet, um die überkauften und überverkauften Bedingungen des Marktes zu messen.
- Der Übergang zwischen dem 45-Perioden-WMA und dem 89-Perioden-EMA wird zur Bestätigung einer Trendänderung verwendet.
- Teilnahmebedingungen:
- Langes Signal: WMA kreuzt EMA und RSI < 50
- Kurzes Signal: WMA unterschreitet EMA und RSI>50
- Das System visualisiert den Marktstatus durch die Farbänderung des RSI. Wenn der RSI > 70 ist, wird er grün angezeigt, und wenn er < 30 ist, wird er rot angezeigt.
- Im RSI-Bereich von 30-70 ist ein blauer Hintergrund eingestellt, um neutrale Bereiche leichter zu identifizieren.
Strategische Vorteile
- Die Kombination mehrerer technischer Indikatoren verbessert die Zuverlässigkeit von Handelssignalen
- Der WMA reagiert stärker auf aktuelle Preisänderungen, während der EMA den langfristigen Trend verfolgt.
- Der RSI fungiert als Filter, um Fehlsignale in übermäßig volatilen Märkten effektiv zu vermeiden.
- Das visuelle Interface-Design hilft Händlern, den Marktstatus intuitiv einzuschätzen
- Enthält ein komplettes Warnsystem, um Händler umgehend über potenzielle Handelsmöglichkeiten zu informieren
Strategisches Risiko
- In einem Seitwärtsmarkt können häufig falsche Ausbruchssignale auftreten
- Die Verzögerung des gleitenden Durchschnitts kann zu einer leichten Verzögerung des Einstiegszeitpunkts führen
- Feste Einstellungen für RSI-Schwellenwerte sind möglicherweise nicht in allen Marktumgebungen angemessen
- Die Nichtberücksichtigung von Volatilitätsfaktoren kann in Zeiten hoher Volatilität das Risiko erhöhen
- Fehlende Stop-Loss- und Stop-Profit-Mechanismen können die Wirkung des Fondsmanagements beeinträchtigen
Richtung der Strategieoptimierung
- Einführung adaptiver RSI-Schwellenwerte, die dynamisch an die Marktvolatilität angepasst werden
- Fügen Sie einen ATR-Indikator hinzu, um die Positionsgröße zu steuern und einen dynamischen Stop-Loss festzulegen
- Optimieren Sie die WMA- und EMA-Periodeneinstellungen und passen Sie sie ggf. an unterschiedliche Zeitrahmen an.
- Lautstärkeanzeige als zusätzliches Bestätigungssignal hinzufügen
- Implementieren Sie komplexere Positionsmanagementsysteme, wie z. B. Pyramidenbildung und Positionsreduzierung
Zusammenfassen
Dabei handelt es sich um eine Trendverfolgungsstrategie, die auf mehreren technischen Indikatoren basiert. Durch die koordinierte Verwendung von RSI, WMA und EMA versucht sie, Wendepunkte von Markttrends zu erfassen und gleichzeitig die Handelsstabilität zu gewährleisten. Obwohl ein gewisses Risiko hinsichtlich Hysterese und Fehlsignalen besteht, bietet diese Strategie durch angemessene Optimierungs- und Risikomanagementmaßnahmen einen guten praktischen Wert und Erweiterungsspielraum.
- 1