Fortgeschrittene Multi-Indikator-Trendbestätigungs-Handelsstrategie

Überblick
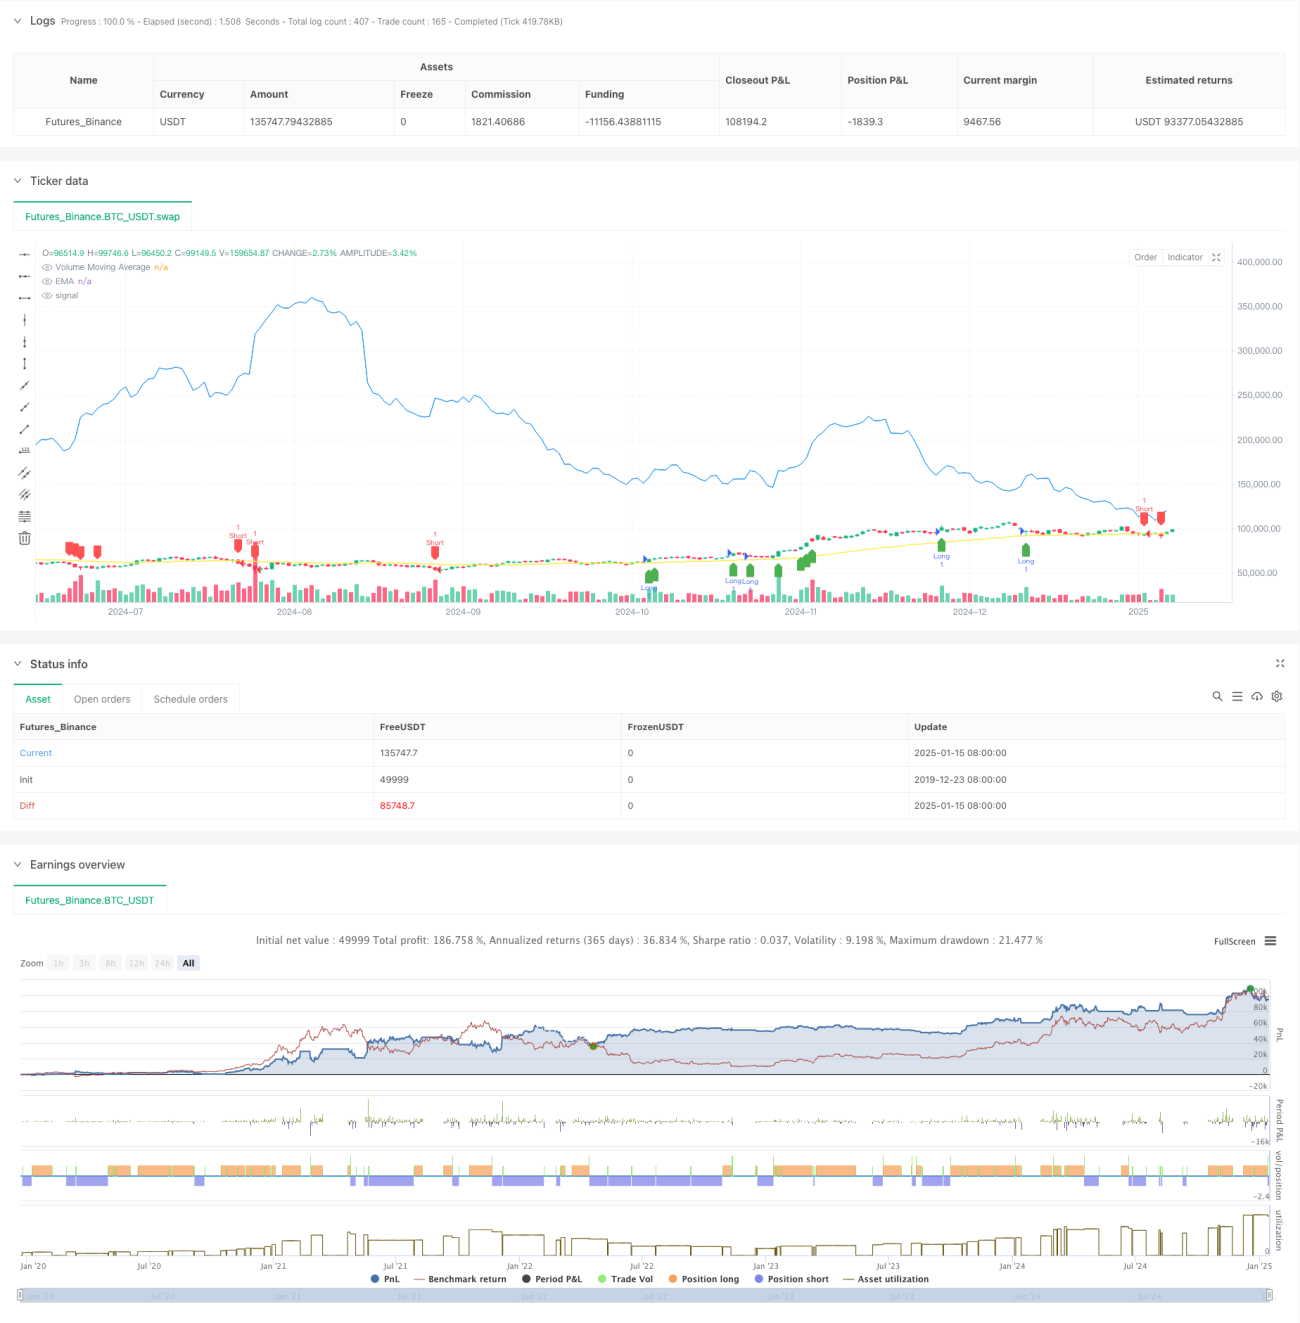
Dies ist eine fortgeschrittene quantitative Handelsstrategie, die einen exponentiellen gleitenden Durchschnitt (EMA), eine Volumenbestätigung und einen durchschnittlichen Trendratenindikator (ATR) kombiniert. Diese Strategie verwendet mehrere technische Indikatoren, um nicht nur Markttrends genau zu erfassen, sondern auch die Transaktionszuverlässigkeit durch Volumenbestätigung zu verbessern. Gleichzeitig wird ATR verwendet, um Stop-Loss- und Take-Profit-Positionen dynamisch anzupassen und so ein umfassendes Risikomanagementsystem zu realisieren. .
Strategieprinzip
Die Kernlogik der Strategie besteht aus drei Hauptteilen:
- Trendbestimmung: Verwenden Sie EMA(50) als Hauptindikator zur Trendbestimmung. Wenn der Preis über dem EMA liegt, wird dies als Aufwärtstrend angesehen, andernfalls als Abwärtstrend.
- Volumenbestätigung: Durch die Berechnung des gleitenden Volumendurchschnitts (Volumen MA) für 20 Perioden muss das aktuelle Volumen nicht nur 1,5-mal höher als der gleitende Durchschnitt, sondern auch größer als das Volumen der vorherigen Periode sein, um sicherzustellen, dass der Markt über ausreichend Beteiligung verfügt.
- Risikomanagement: Legen Sie Stop-Loss- und Take-Profit-Positionen dynamisch auf Basis des 14-Perioden-ATR fest. Der Stop-Loss wird auf das Zweifache des ATR und der Take-Profit auf das Dreifache des ATR eingestellt. Diese Einstellung schützt nicht nur die Sicherheit der Gelder, sondern gibt dem Trend auch Raum, sich voll zu entwickeln.
Strategische Vorteile
- Mehrfachbestätigungsmechanismus: Durch die doppelte Bestätigung von Trend und Volumen wird die Zuverlässigkeit der Handelssignale erheblich verbessert.
- Dynamisches Risikomanagement: Die Verwendung von ATR für dynamische Stop-Loss- und Take-Profit-Einstellungen ermöglicht eine bessere Anpassung an Änderungen der Marktvolatilität.
- Hohe Flexibilität: Die Strategieparameter können an unterschiedliche Marktbedingungen angepasst werden und sind äußerst anpassungsfähig.
- Klare Visualisierung: Die Strategie bietet eine klare grafische Signalanzeige, die es Händlern erleichtert, intuitive Urteile zu fällen.
Strategisches Risiko
- Trendumkehrrisiko: Unter volatilen Marktbedingungen kann die EMA hinterherhinken, was zu verzögerten Signalen führt.
- Falscher Ausbruch aufgrund des Handelsvolumens: Unter bestimmten besonderen Marktbedingungen kann ein hohes Handelsvolumen ein Ausdruck eines falschen Ausbruchs sein.
- Stop-Loss-Bereich: In manchen Fällen kann die Stop-Loss-Einstellung von 2 x ATR zu groß sein und muss bei der Anpassung berücksichtigt werden.
Richtung der Strategieoptimierung
- Einführung von Trendstärkeindikatoren: Erwägen Sie die Hinzufügung von Trendstärkeindikatoren wie ADX, um die Genauigkeit der Trendbeurteilung weiter zu verbessern.
- Volumenfilterung optimieren: Es können komplexere Methoden der Volumenanalyse eingeführt werden, wie etwa OBV oder volumengewichteter gleitender Durchschnitt.
- Verbessern Sie den Stop-Loss-Mechanismus: Erwägen Sie die Hinzufügung eines gleitenden Stop-Loss oder einer Stop-Loss-Methode basierend auf Unterstützungs- und Widerstandsniveaus.
- Zeitfilter hinzugefügt: Filter für den Handelszeitraum hinzugefügt, um falsche Signale während Zeiten geringer Marktaktivität zu vermeiden.
Zusammenfassen
Diese Strategie etabliert ein logisch strenges Handelssystem durch die umfassende Verwendung mehrerer technischer Indikatoren. Die Kernvorteile der Strategie liegen in ihren vielfältigen Bestätigungsmechanismen und dem dynamischen Risikomanagement, allerdings muss auch auf Risiken wie Trendumkehr und falsche Volumendurchbrüche geachtet werden. Durch kontinuierliche Optimierung und Verbesserung soll mit dieser Strategie eine bessere Performance bei tatsächlichen Transaktionen erzielt werden.
- 1