Momentum-adaptive Mehrperiodenstrategie mit Gaussian Channel

Überblick
Die Strategie ist ein dynamisches Handelssystem, das auf Gauss-Kanal und Random RSI-Indikatoren basiert, kombiniert mit saisonaler Filterung und Volatilitätsmanagement. Die Strategie identifiziert Markttrends durch Anpassung an den Gauss-Kanal, verwendet die Random RSI zur Dynamikbestätigung und führt Geschäfte innerhalb bestimmter saisonaler Fenster aus. Das System integriert auch eine ATR-basierte Positionsmanagement, um die Risikothek für jeden Handel zu kontrollieren.
Strategieprinzip
Im Mittelpunkt der Strategie steht ein Preiskanal, der auf einem multipolaren Gaussfilter aufgebaut ist. Dieser Kanal bildet eine dynamische Auf- und Abwärtsbahn, indem er den Gausswert des HLC3-Preises berechnet und die Ergebnisse der Wave mit der tatsächlichen Schwankungsbreite (TR) kombiniert. Die Erzeugung eines Handelssignals erfordert folgende Bedingungen:
- Die Preise brechen durch und die Hauptwellen bewegen sich nach oben
- Der RSI zeigt überkauft
- Die aktuelle Zeit innerhalb des vorgegebenen saisonalen Fensters
- Positionsgröße basiert auf ATR-Dynamik
Die Plain-Position-Signal wird durch einen Kursrückgang ausgelöst. Das gesamte System erhöht die Stabilität des Handels durch mehrere Filtermechanismen.
Strategische Vorteile
- Die Gauss-Filter haben eine hervorragende Geräuschfilterfähigkeit und sind in der Lage, echte Markttrends zu erfassen
- Mehrpolar-Design bietet präzisere Grenzen für Preiskanäle
- Integration von Dynamik- und Trendindikatoren zur Erhöhung der Signalsicherheit
- Saisonale Filterung hilft bei der Vermeidung ungünstiger Marktumstände
- Dynamisches Positionsmanagement sorgt für Risikokonsistenz
- Systemparameter können je nach Marktbedingungen optimiert werden
Strategisches Risiko
- Goss filter ist kompliziert und kann die Ausführung verzögern
- Mehrfache Filterbedingungen könnten wichtige Handelschancen verpassen
- Das System ist sehr sensibel für Parameter, die sorgfältig optimiert werden müssen.
- Die festgelegte Einstellung des saisonalen Fensters kann sich nicht an veränderte Marktbedingungen anpassen
- Während der hohen Volatilität kann die ATR-basierte Positionskontrolle zu konservativ sein
Richtung der Strategieoptimierung
- Einführung einer anpassungsfähigen saisonalen Fenster, um die Handelszeiten dynamisch an die Marktbedingungen anzupassen
- Optimierung der Rechenleistung des Gauss-Filters und Verringerung der Ausführungsverzögerung
- Eintritt in die Marktschwankungsregelung, um die Filterbedingungen für unterschiedliche Marktbedingungen anzupassen
- Entwicklung eines flexibleren Positionsmanagementsystems, das Risiken und Erträge ausgleicht
- Mehrzeit-Analysen zur Erhöhung der Signalsicherheit
Zusammenfassen
Es handelt sich um ein gut aufgebautes Trend-Tracking-System, das die Stabilität des Handels durch mehrschichtige Filterung und Risikomanagement verbessert. Obwohl einige Optimierungsmöglichkeiten vorhanden sind, entspricht die Gesamtkonzeption den Anforderungen des modernen quantitativen Handels. Der Schlüssel zum Erfolg der Strategie liegt in der präzisen Anpassung der Parameter und der Anpassung an die Marktumgebung.
/*backtest
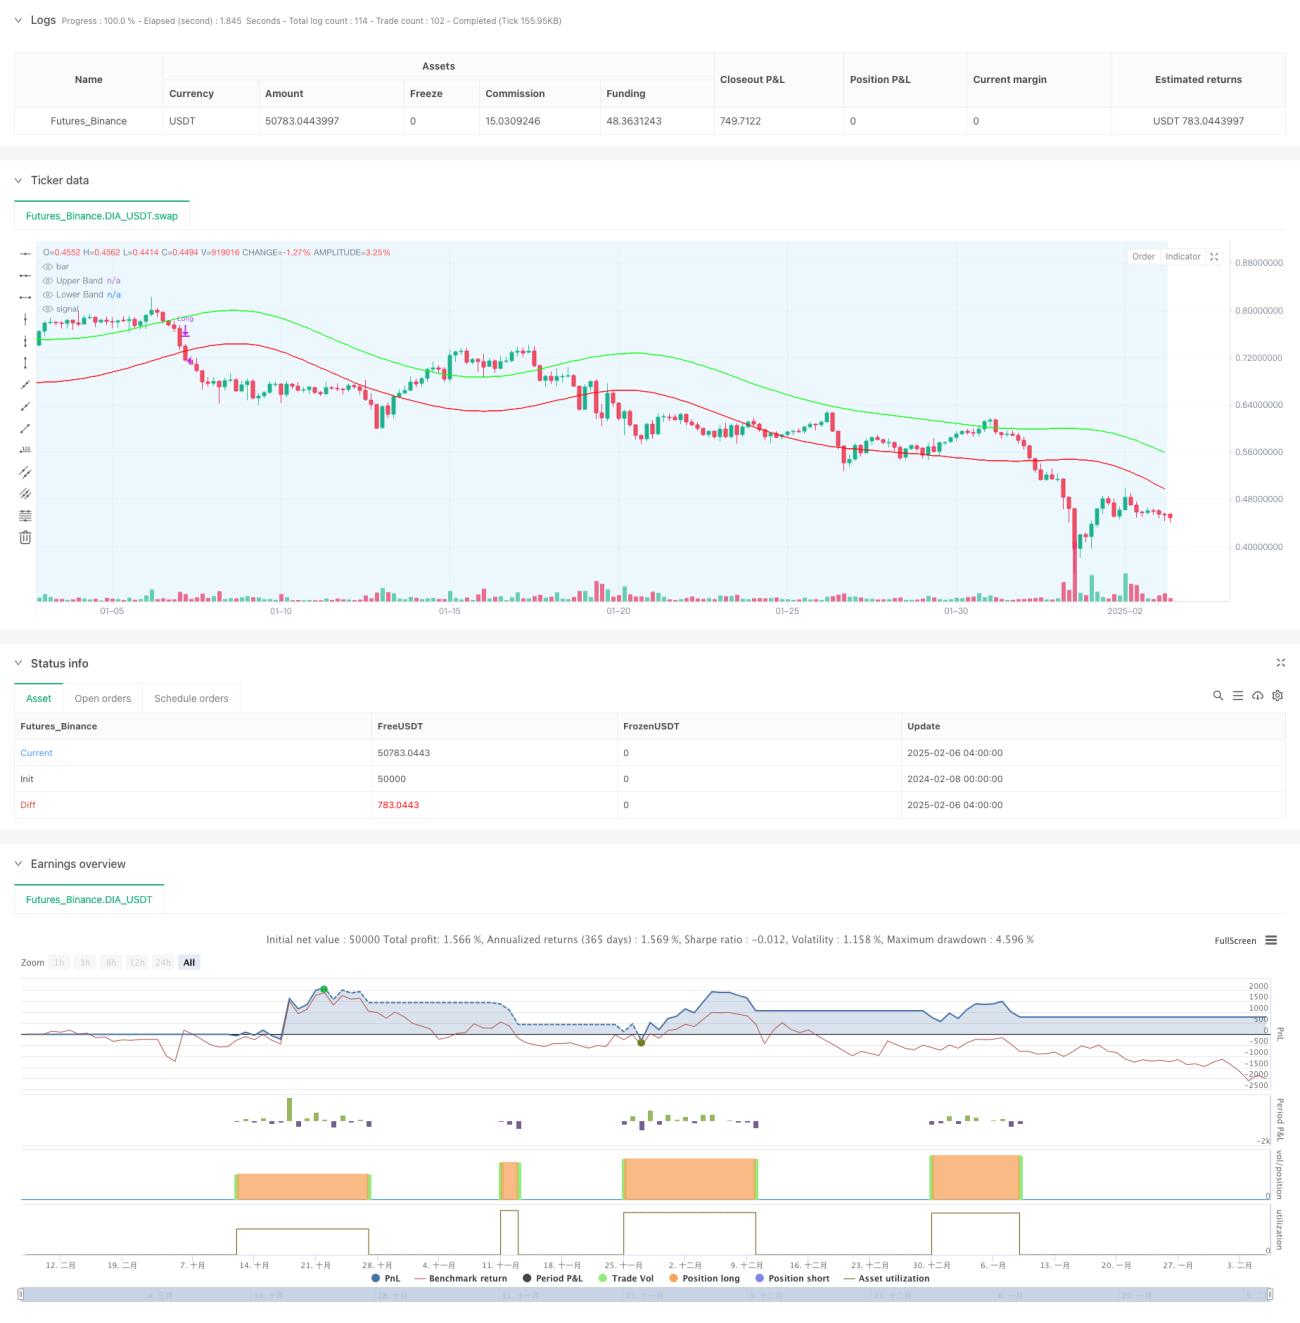
start: 2024-02-08 00:00:00
end: 2025-02-06 08:00:00
period: 4h
basePeriod: 4h
exchanges: [{"eid":"Futures_Binance","currency":"DIA_USDT"}]
*/
//@version=6
strategy("Demo GPT - Gold Gaussian Strategy", overlay=true, commission_type=strategy.commission.percent, commission_value=0.1)
// ====== INPUTS ======- 1