Dynamische RSI-erweiterte Exponential Moving Average Trend Trading Strategie

Überblick
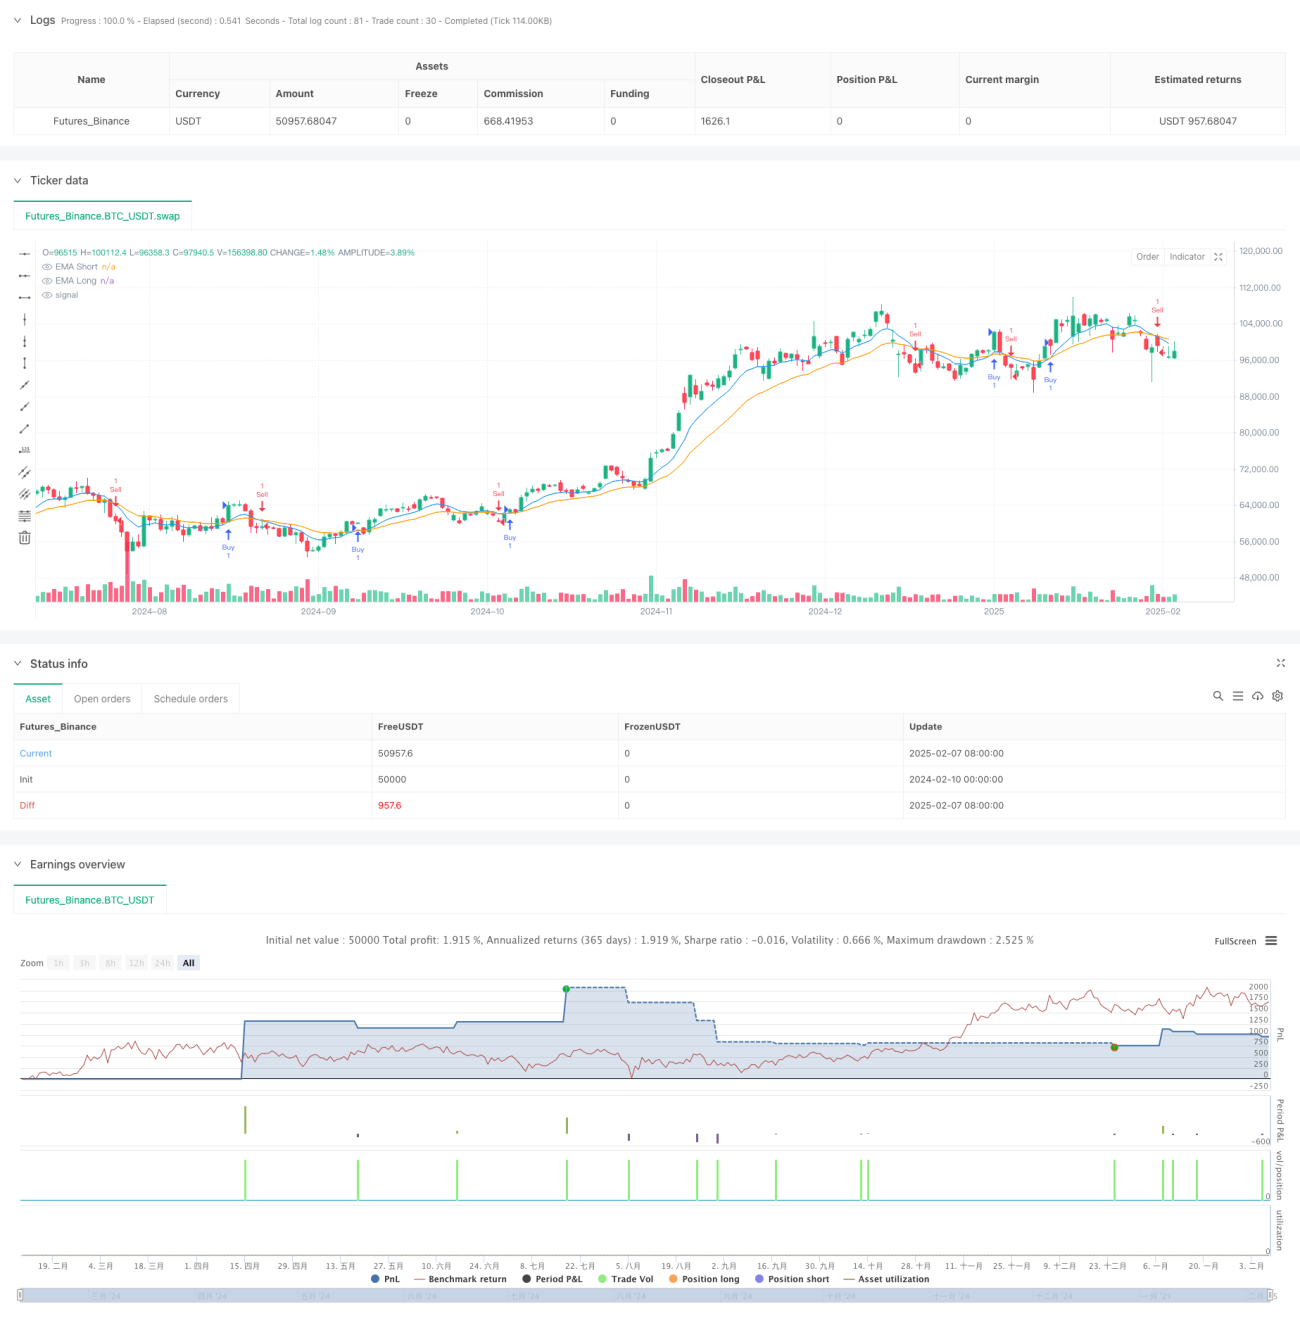
Die Strategie ist ein dynamisches Trend-Tracking-System, das einen Index-Moving Average (EMA) und einen relativ starken Indikator (RSI) kombiniert. Es identifiziert die Trendrichtung durch eine Kreuzung von 9- und 21-Zyklus-EMA und verwendet den RSI als Trendbestätigungsindikator. Die Strategie enthält auch ein vollständiges Geldmanagementsystem, einschließlich der Einstellung von dynamischen Stop-Loss- und Gewinnzielen.
Strategieprinzip
Die Kernlogik der Strategie basiert auf den folgenden Schlüsselelementen:
- Kurzzeit- (Zyklus 9) und Langzeit- (Zyklus 21) EMA-Kreuzungen werden verwendet, um Trendänderungen zu erfassen
- Die Trendbestätigung durch den 14-Zyklus-RSI-Indikator erfordert, dass der RSI> 50 zu viel ist und der RSI < 50 zu wenig ist
- Die Stop-Loss-Einstellung mit einer festen Punktzahl (default 30 Punkte) und die Haltungsgröße basierend auf der Dynamik des Risikos
- Dynamische Berechnung des Gewinnzielpreises unter Verwendung der Parameter der Kapitalverwaltung
- Eintrittsmarken, Zielpreise und Stop-Loss-Positionen in Echtzeit auf der Grafik angezeigt
Strategische Vorteile
- Kombination von Trend- und Dynamik-Indikatoren erhöht die Zuverlässigkeit von Handelssignalen
- Vollständiges Geldmanagementsystem, mit flexibler Risikobereitschaft je nach Kontogröße
- Klare visuelle Feedbacksysteme, einschließlich der Markierung von gescheiterten Transaktionen
- Die Parameter sind vollständig anpassbar für verschiedene Handelsstile
- Automatisierte Ein- und Ausfahrten, weniger menschliche Intervention
Strategisches Risiko
- EMA als nachlassender Indikator kann in stark schwankenden Märkten zu Verzögerungssignalen führen
- In einem Seitwärtsmarkt können häufig falsche Ausbruchssignale auftreten
- Fixed-Point-Stop-Losses können nicht flexibel genug sein, wenn sich die Volatilität ändert
- Die Parameter müssen sorgfältig an unterschiedliche Marktbedingungen angepasst werden.
- Risiken von Ausrutschen bei geringer Liquidität
Richtung der Strategieoptimierung
- Einführung von adaptiven Stop-Loss-Mechanismen wie ATR-basierten dynamischen Stop-Losses
- Hinzufügen von Marktschwankungsfiltern und Anpassung der Strategieparameter während hoher Schwankungen
- Hinzufügen von Handelszeitfiltern, um zu schlechten Zeiten zu handeln
- Entwicklung eines intelligenten Positionsmanagementsystems, das die Marktvolatilität berücksichtigt
- Einführung zusätzlicher Indikatoren zur Filterung von Falschsignalen
Zusammenfassen
Die Strategie baut ein vollständiges Trend-Tracking-System auf, indem sie EMA-Kreuzungen und RSI-Bestätigungen kombiniert. Ihr Hauptvorteil liegt in der organischen Kombination von technischen Analysen und Risikomanagement, mit guter Skalierbarkeit und Anpassungsfähigkeit. Obwohl einige inhärente Risiken vorhanden sind, bietet die Strategie den Händlern durch kontinuierliche Optimierung und Parameteranpassung einen soliden Handelsrahmen.
- 1