
Überblick
Es handelt sich um eine Triple-Meanline-Trend-Tracking-Strategie, die auf der Oliver Valez-Handelsmethode basiert. Die Strategie nutzt die Kreuzung von 20-, 50- und 200-Perioden-Moving Averages, um Markttrends und Handelsmöglichkeiten zu identifizieren. Die 200-Perioden-Meanline dient als Haupttrendfilter, während die Kreuzung von 20 und 50-Perioden-Meanlines verwendet wird, um spezifische Handelssignale zu erzeugen.
Strategieprinzip
Die Kernlogik der Strategie besteht aus drei Schlüsselbereichen:
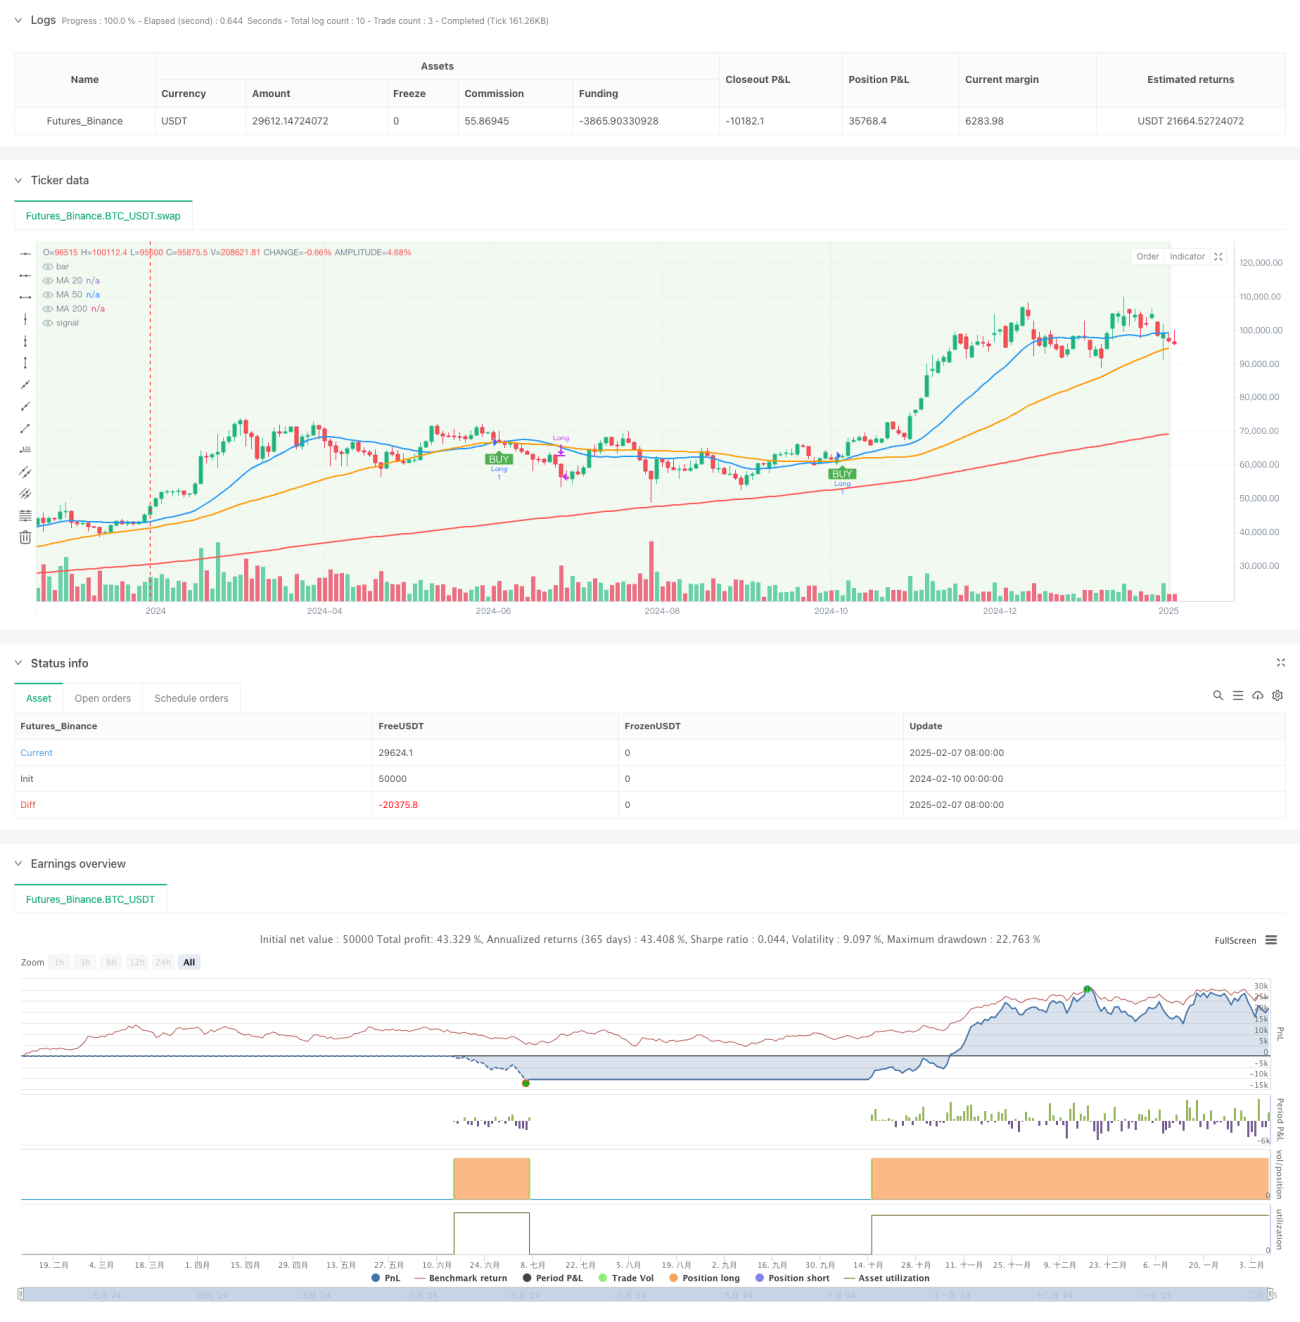
- Trenderkennung: Die 200-Perioden-Mittellinie wird als Trendgrenze verwendet. Wenn der Preis oberhalb der 200-Mittellinie liegt, wird er als Aufwärtstrend angesehen. Wenn der Preis unterhalb der 200-Mittellinie liegt, wird er als Abwärtstrend angesehen.
- Handelssignale: In einem Aufwärtstrend wird ein Mehrsignal ausgelöst, wenn die 20-Perioden-Gewinnlinie die 50-Perioden-Gewinnlinie aufwärts durchquert. In einem Abwärtstrend wird ein Abbruchsignal ausgelöst, wenn die 20-Perioden-Gewinnlinie die 50-Perioden-Gewinnlinie nach unten durchquert.
- Risikokontrolle: Die Strategie hat einen Standard-Stopp von 2% und einen Stop-Loss von 4%, wobei die Position automatisch gelöscht wird, wenn ein umgekehrtes Kreuzsignal auftritt.
Strategische Vorteile
- Mehrere Bestätigungsmechanismen: Durch die kombinierte Verwendung von drei Gleichlinien wird ein zuverlässigeres Handelssignal bereitgestellt.
- Trendfilter: Die Trendfilterfunktion mit 200 Gleichungen reduziert effektiv das Risiko von Falschbrüchen.
- Flexibilität: Unterstützung für den Wechsel zwischen SMA und EMA, Anpassung der Parameter an die Merkmale des Marktes.
- Risikomanagement: Eingebettete Stop-Loss-Stopp-Mechanismen zur Sicherung der Kapitalsicherheit.
- Visualisierung: Trends werden durch die Farbänderung des Hintergrundes visuell dargestellt.
Strategisches Risiko
- Verzögerung: Der Moving Average ist ein Verzögerungsindikator und kann zu einer geringfügigen Verzögerung bei der Ein- oder Ausstiegszeit führen.
- Nicht für die Schaukel-Marke: Häufige Durchschnittskreuzungen können falsche Signale erzeugen.
- Das Risiko eines festen Stop-Losses: Die Verwendung eines festen Stop-Losses kann nicht für alle Marktbedingungen geeignet sein.
- Parameter-Sensitivität: Unterschiedliche Methodik-Einstellungen können zu deutlich unterschiedlichen Ergebnissen führen.
Richtung der Strategieoptimierung
- Einführung von Traffic Analysis: Traffic-Bestätigungskennzahlen können hinzugefügt werden, um die Signalzuverlässigkeit zu verbessern.
- Dynamische Stop-Loss-Einstellungen: Erwägen Sie, die Stop-Loss-Position dynamisch zu verändern, indem Sie ATR oder die Schwankungsrate anpassen.
- Erhöhung der Trendstärke-Filterung: Trendstärke-Indikatoren wie ADX können eingeführt werden, um die Umgebung mit schwachen Trends zu filtern.
- Optimierung der Eintrittszeit: Die Kombination von Preisform und Unterstützung des Widerstands erhöht die Eintrittsgenauigkeit.
- Hinzu kommt ein Zeitfilter: Es ist möglich, ein Zeitfenster für den Handel einzurichten, um volatile Zeiten zu vermeiden.
Zusammenfassen
Es handelt sich um eine strukturierte, logisch klare Trendverfolgungsstrategie. Durch die synchronisierte Zusammenarbeit mit der dreifachen Mittellinie wird sowohl die Genauigkeit der Trenderkennung gewährleistet als auch ein klares Handelssignal bereitgestellt. Die Risikomanagementmechanismen der Strategie sind relativ vollständig, es besteht jedoch noch Raum für Optimierung.
- 1