Handelsstrategie zur Optimierung des Überkaufs- und Überverkaufsbereichs mit doppeltem gleitenden Durchschnitt und stochastischem RSI

Überblick
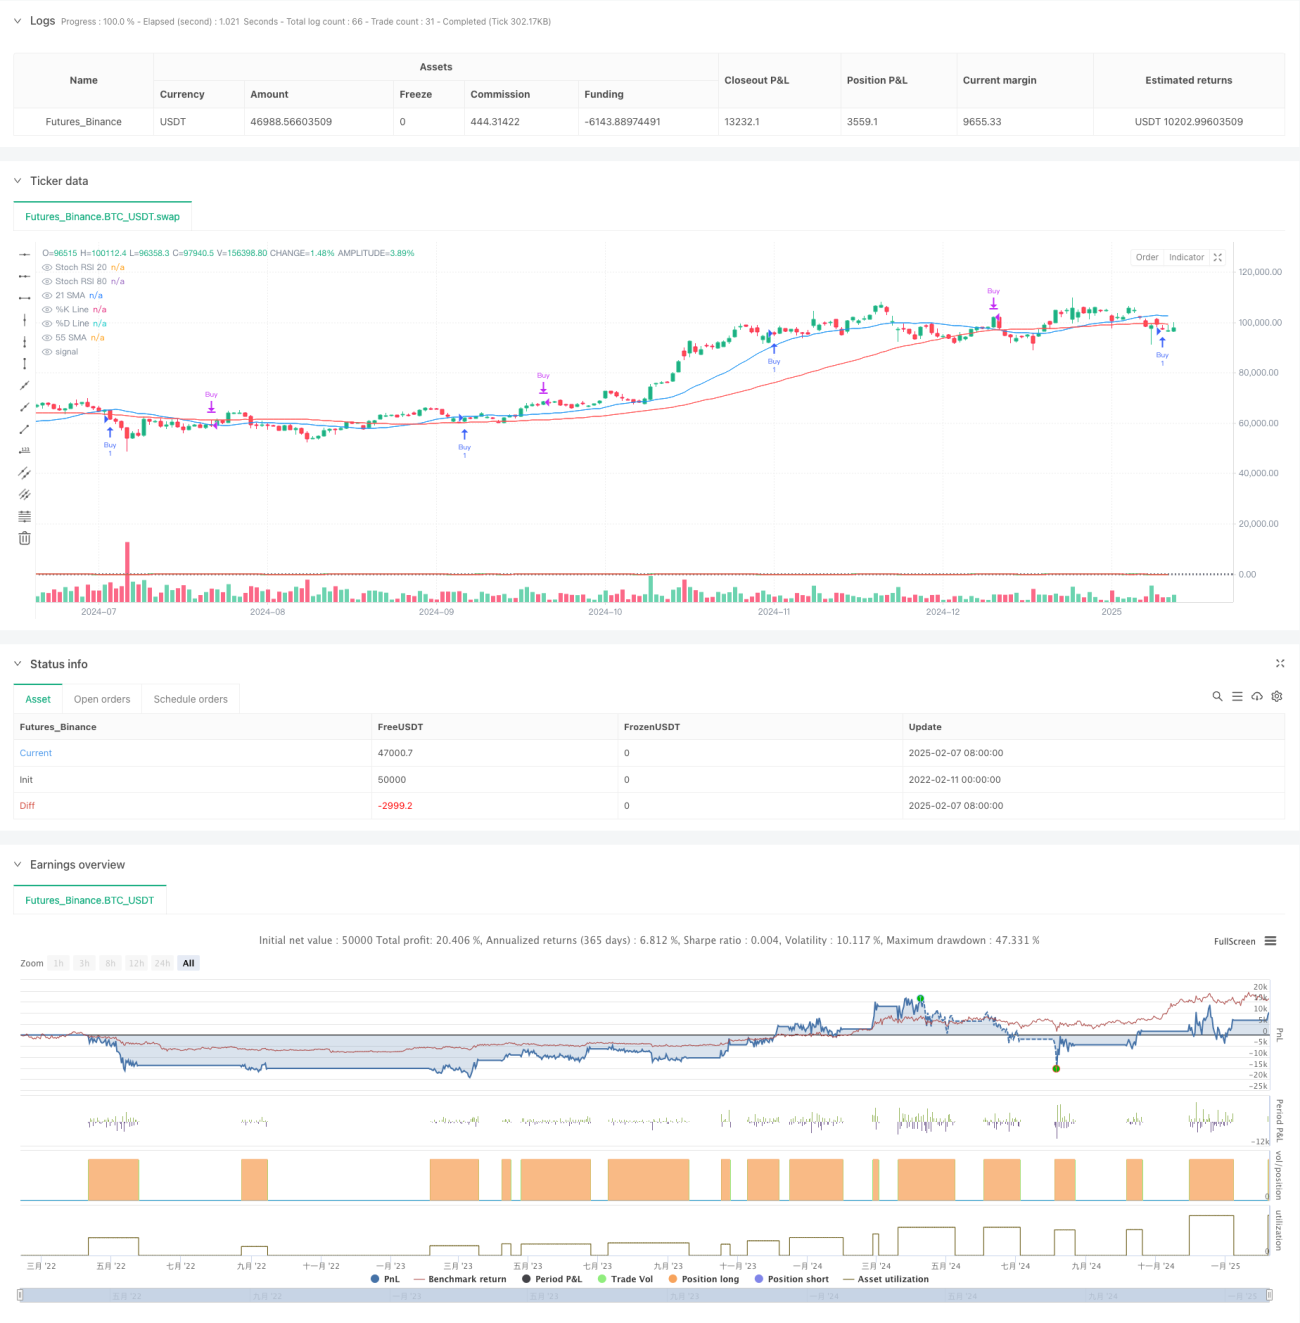
Die Strategie ist ein Trend-Tracking-Trading-System, das eine Kombination aus einer doppelten Mittellinie und einem randomisierten RSI-Indikator enthält. Die Strategie beurteilt die Markttrends anhand eines einfachen Moving Averages mit 21 und 55 Zyklen und sucht nach optimalen Ein- und Ausstiegspunkten in überkauften und überverkauften Zonen, um den Trend zu optimieren. Die Strategie basiert auf der Bestätigung von Aufwärtstrends und sucht nach Kaufmöglichkeiten in überkauften Zonen und nach Verkaufsmöglichkeiten in überkauften Zonen.
Strategieprinzip
Die Strategie basiert auf folgenden Kernlogiken:
- Trendbestätigung: Mit einem 21-Zyklus-SMA und einem 55-Zyklus-SMA wird ein Aufwärtstrend bestätigt, wenn der kurzfristige Durchschnittswert über dem langfristigen liegt.
- Eintrittssignal: Die K-Linie des zufälligen RSI bildet nach der Trendbestätigung eine goldene Kreuzung mit der D-Linie in der Überverkaufszone unter 20.
- Ausgangssignal: Ausgangsschaltung, wenn die K-Linie des zufälligen RSI eine Todeskreuzung mit der D-Linie in einem überkauften Bereich von über 80 bildet.
- Signalfilter: Wirksam zur Verringerung von Falschsignalen durch Kombination von Trend- und Dynamikindikatoren.
Strategische Vorteile
- Mehrere Bestätigungsmechanismen: Erhöhung der Zuverlässigkeit von Transaktionen durch Trend- und Dynamik-Doppelbestätigung.
- Optimierung der Risikokontrolle: Nutzung der Überkauf-Überverkauf-Bereich, um einen besseren Einstiegspunkt in die Richtung des Trends zu wählen.
- Anpassungsfähigkeit: Die Strategieparameter können an unterschiedliche Markteigenschaften angepasst werden.
- Die Ein- und Ausstiegsbedingungen sind klar und einfach zu handhaben.
- Ein hoher Grad an Systematisierung: Strategische Logik ist vollständig systematisiert und subjektive Urteile werden reduziert.
Strategisches Risiko
- Schwankungsrisiko: Häufige Transaktionen können auf schwankenden Märkten erfolgen.
- Rückstandsrisiko: Der Moving Average hat eine gewisse Rückstandsfähigkeit und kann die beste Einstiegsmomente verpassen.
- Falsche Durchbruchrisiken: Der zufällige RSI könnte falsche Signale in einem schwankenden Markt erzeugen.
- Parametersensitivität: Unterschiedliche Parameterkombinationen können zu großen Unterschieden in der Strategieleistung führen.
Richtung der Strategieoptimierung
- Hinzufügung von Volatilitätsfiltern: Einführung von ATR-Indikatoren, um die Häufigkeit der Transaktionen während der niedrigen Volatilität zu verringern.
- Optimierung der Ausstiegsmechanismen: Einbeziehung von mobilen Stop-Loss- oder Gewinnzielen kann in Erwägung gezogen werden.
- Klassifizierung des Marktumfelds: Parameter für die Anpassung an die Dynamik des Marktumfelds.
- Erhöhung des Transaktionsvolumens: Hinzufügen eines Transaktionsvolumens, um die Wirksamkeit des Signals zu überprüfen.
- Einführung von Trendstärke-Indikatoren wie ADX, um schwache Trendumgebungen zu filtern
Zusammenfassen
Die Strategie baut durch die Kombination klassischer technischer Indikatoren ein vollständiges Trend-Tracking-Handelssystem auf. Die Strategie bleibt einfach und intuitiv, erhöht die Zuverlässigkeit durch Multi-Signal-Bestätigung. Durch eine vernünftige Parameteroptimierung und Risikomanagement hat die Strategie einen guten praktischen Wert.
- 1