
Überblick
Die Strategie ist ein Trend-Tracking-System, das mehrere technische Indikatoren kombiniert, um eine vollständige Handelsentscheidungsrahmen durch die Integration von Moving Averages (EMA), Relative Strength Indicators (RSI), Moving Average Convergence Divergence Indicators (MACD) und Bolling Bands (BB) zu erstellen. Die Strategie verwendet eine dynamische Risikomanagement-Methode, einschließlich einer prozentualen Stop-Loss- und einer risikobasierten Stop-Reward-Vergleiche, um einen stabilen, risikobereinigten Gewinn zu erzielen.
Strategieprinzip
Die Kernlogik der Strategie basiert auf einer vielschichtigen Marktanalyse:
- Trendbestätigung: Die Verwendung einer 200-Tage-EMA zur Festlegung der langfristigen Trendrichtung, die Kreuzbestätigung der mittelfristigen Trendänderungen des schnellen EMA ((20 Tage) und des langsamen EMA ((50 Tage))
- Dynamik-Verifizierung: Doppel-Verifizierung der Marktdynamik mit dem RSI-Indikator und dem MACD, wobei der RSI über 50 (Multiple) oder unter 50 (Blank) liegt, während die MACD-Signalleitung die entsprechende Richtung unterstützt
- Volatilitätskontrolle: Genauere Zeitmessung der Transaktionen über die Brin-Band, Suche nach Mehr-Chancen in den unteren Bahnstützpunkten, Suche nach Short-Chancen in den oberen Bahnwiderstandspunkten
- Risikomanagement: Ein Stop-Loss-Satz von 2% und ein Stop-Loss-Level mit einem Risiko-Gewinn-Verhältnis von 1,5-mal, um sicherzustellen, dass das Risiko für jeden Handel kontrollierbar ist
Strategische Vorteile
- Multidimensionelle Analyse: Verringern Sie die Auswirkungen von Falschsignalen durch Kombination von Trend-, Dynamik- und Volatilitätsindikatoren
- Gute Risikokontrolle: Die vorgegebenen Stop-Loss- und Stop-Stop-Levels gewährleisten die Risikokontrolle des Handels
- Anpassungsfähigkeit: Strategieparameter können an unterschiedliche Marktbedingungen angepasst werden
- Durchführbarkeit: Ein- und Ausstiegsbedingungen sind klar, einfach umzusetzen und zu überwachen
- Geldverwaltung ist vernünftig: Positionskontrolle mit Kontogewinnprozentsätzen, um übermäßige Risiken zu vermeiden
Strategisches Risiko
- Risiken von Marktschwankungen: Häufige Stop-Losses können während hoher Schwankungen ausgelöst werden
- Risiko für eine Trendwende: An einem Trendwendepunkt könnte ein größerer Rückzug eintreten
- Risiko der Parameteroptimierung: Überoptimierung kann zu Überanpassung führen
- Ausführungsrisiken: Bei mangelnder Liquidität können größere Ausrutscher auftreten
- Risiken von Provisionskosten: Häufige Transaktionen können zu höheren Transaktionskosten führen
Richtung der Strategieoptimierung
- Dynamische Parameteranpassung: Indikatorparameter können automatisch an die Marktfluktuation angepasst werden
- Erhöhung der Stimmungsindikatoren: Einführung von Kennzahlen wie Transaktionsvolumen, um die Signalsicherheit zu erhöhen
- Optimierung von Stop-Loss-Mechanismen: Erreichen von Tracking-Stopp-Loss und Erhöhung der Gewinnschutzfähigkeit
- Einführung von Zeitfiltern: Erweiterung der Filterung von Handelszeitfenstern
- Hinzufügen von Volatilitätsfiltern: Verringerung von Positionen oder Aussetzung des Handels in Zeiten von übermäßiger Volatilität
Zusammenfassen
Die Strategie baut ein vollständiges Trend-Tracking-Trading-System auf, indem sie mehrere technische Indikatoren kombiniert verwendet. Durch strenge Risikomanagement und eine mehrdimensionale Marktanalyse hat die Strategie eine gute Anpassungsfähigkeit und Stabilität. Obwohl es einen gewissen Optimierungsraum gibt, ist die Gesamtrechnerkonstruktion vernünftig und passt als Grundlage für eine mittelfristige Handelsstrategie.
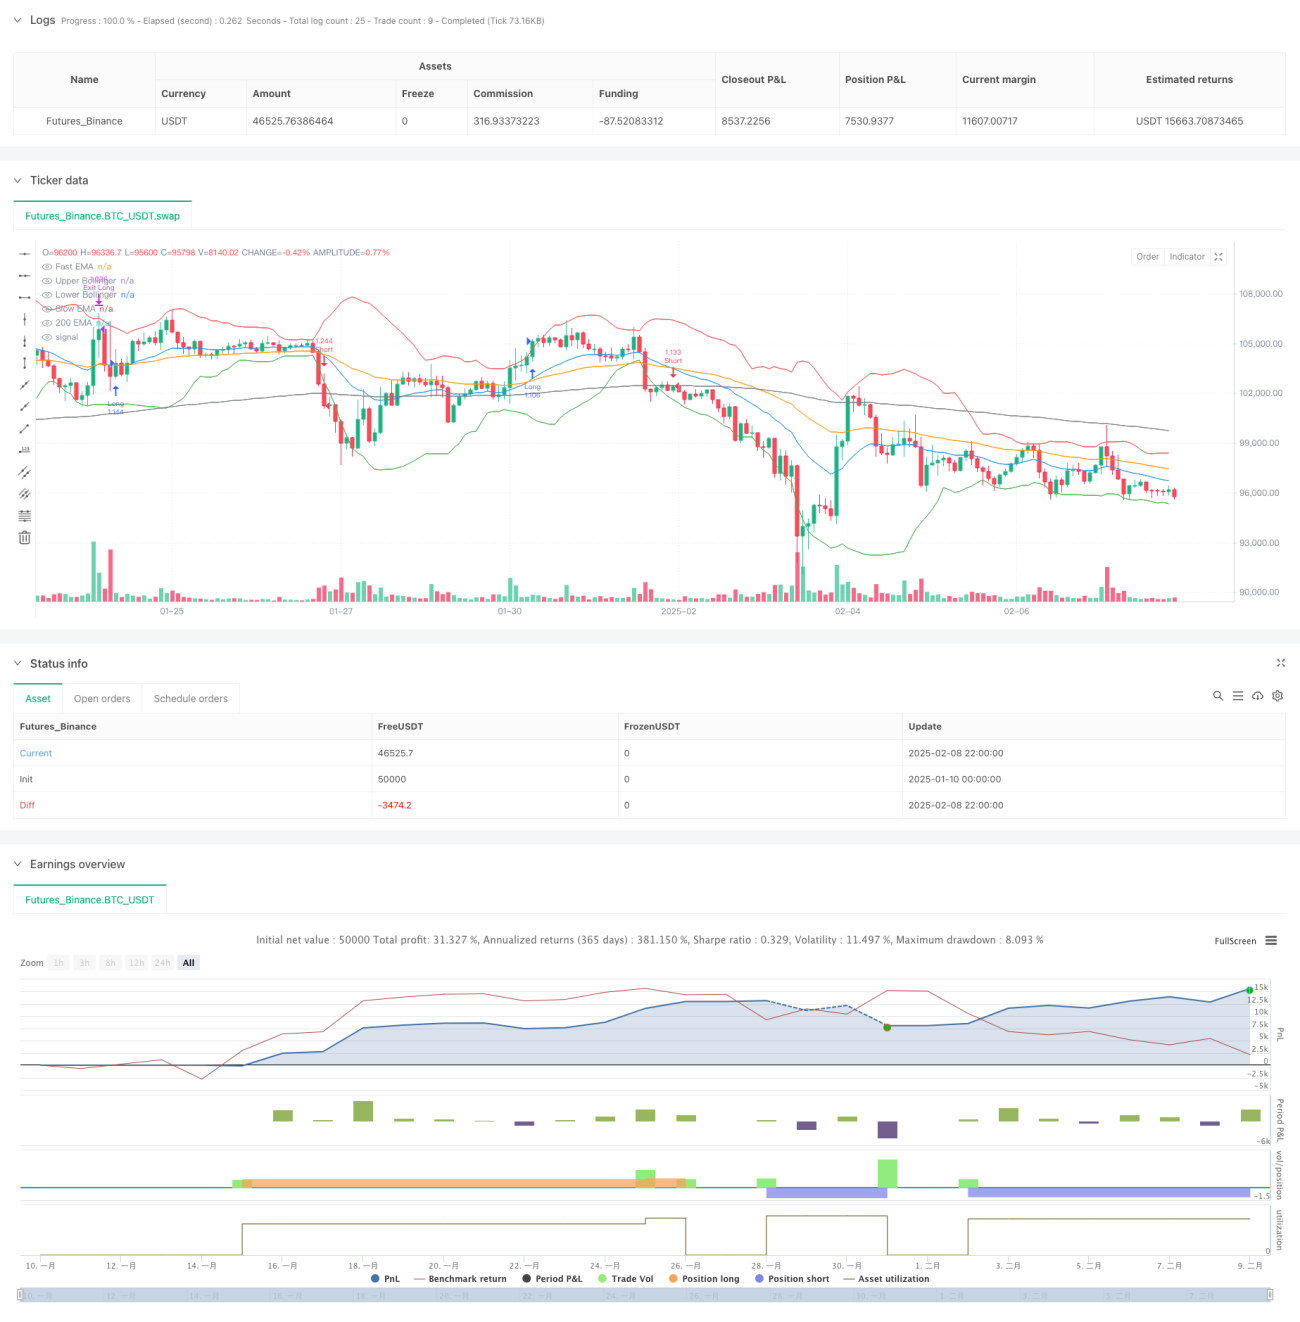
/*backtest
start: 2025-01-10 00:00:00
end: 2025-02-09 00:00:00
period: 2h
basePeriod: 2h
exchanges: [{"eid":"Futures_Binance","currency":"BTC_USDT"}]
*/

//@version=5
strategy("Altcoin Long/Short Strategy", overlay=true, initial_capital=1000, default_qty_type=strategy.percent_of_equity, default_qty_value=200, commission_type=strategy.commission.percent, commission_value=0.1)

// —————— Inputs ——————- 1