Trend-Momentum-Strategie - Zickzack-Mehrperioden-Dynamisches Band-Timing-System

Überblick
Die Strategie ist ein multidimensionales Trading-System, das den ZigZag- und den %R-William-Index kombiniert. Durch den ZigZag-Index werden wichtige Bandbreiten-Höchst- und Tiefpunkte identifiziert, während der William-Index verwendet wird, um die Einstiegspunkte zu bestätigen, wenn der Markt überkauft oder überverkauft ist. Diese Kombination kann nicht nur die wichtigsten Trendwendepunkte des Marktes erfassen, sondern auch die Genauigkeit des Handels durch Dynamikbestätigung verbessern.
Strategieprinzip
Die Kernlogik der Strategie basiert auf zwei Hauptkomponenten:
- Der Wörterbuch-Indikator identifiziert durch die festgelegte Tiefe und Abweichungsparameter signifikante Bandhöhen und -tiefpunkte, filtert Marktlärm und bestimmt die Trendrichtung. Wenn ein neuer Bandtiefpunkt gebildet wird, zeigt dies den Beginn eines Aufwärtstrends an, und ein neuer Bandhochpunkt zeigt den Beginn eines Abwärtstrends.
- Der William-Indikator berechnet die Dynamik des Marktes, indem er den aktuellen Preis mit dem Höchstpreis in einer bestimmten Periode vergleicht. Wenn der Indikatorwert 80 überschreitet, bedeutet dies Überverkauf (potentielle Kaufmöglichkeit), und ein Durchbruch von 20 bedeutet Überkauf (potentielle Verkaufsmöglichkeit).
Die Handelsregeln der Strategie lauten wie folgt:
- Multi-Bedingung: Der Wörterbuch-Indikator erkennt neue Bandtiefpunkte und der William-Indikator springt aus der Überverkaufszone nach oben
- Leerlaufbedingungen: Der Wortsymbol-Indikator identifiziert neue Bandhochpunkte und der William-Indikator bricht aus der Überkaufszone nach unten
- Stop-Loss-Einstellung ist 1%, Stop-Stop-Einstellung ist 2%.
Strategische Vorteile
- Multidimensionelle Bestätigung: Verbesserung der Zuverlässigkeit von Handelssignalen durch Trend- und Dynamik-Doppelbestätigung
- Anpassungsfähigkeit: Die Abweichungsparameter des Wörterform-Indikators können dynamisch an die Marktfluktuation angepasst werden
- Gute Risikokontrolle: Eine Stop-Loss-Strategie mit einem festen Prozentsatz, um das Risiko für jeden Handel zu kontrollieren
- Gute Visualisierung: Handelssignale werden durch Etiketten und Grafiken klar dargestellt, um sie zu analysieren und zu optimieren
Strategisches Risiko
- Schwankungsrisiko: Häufige falsche Durchbruchsignale in den OTC-Märkten
- Rutschrisiko: Bei schnellen Fahrten kann es zu einem größeren Rutsch kommen.
- Parameter-Sensitivität: Die Auswahl der Indikatorparameter hat einen großen Einfluss auf die Strategie-Performance
- Signalverzögerung: Einige schnelle Ereignisse können verpasst werden, da neue Bandbreiten bestätigt werden müssen.
Richtung der Strategieoptimierung
- Zusätzliche Marktumfeld-Filterung: Fluktuationsindikatoren können hinzugefügt werden, um den Marktzustand zu identifizieren, wobei verschiedene Parameter-Einstellungen für verschiedene Umgebungen verwendet werden
- Dynamische Stop-Loss-Optimierung: Die Stop-Loss-Position kann dynamisch anhand des ATR oder der Volatilität angepasst werden
- Einführung der Transaktionsbestätigung: Erhöhung der Transaktionsbestätigung bei der Signalerzeugung
- Zeit-Filter: Sie können einen Zeitbereich-Filter hinzufügen, um zu vermeiden, dass Sie zu schwankenden Zeiten handeln.
Zusammenfassen
Es ist ein vollständiges Handelssystem, das Trendverfolgung und Dynamikhandel kombiniert. Durch die synchronisierte Wirkung mehrerer technischer Indikatoren ist es möglich, das Risiko effektiv zu kontrollieren, während eine hohe Gewinnrate beibehalten wird. Obwohl es eine gewisse Rückständigkeit gibt, können durch eine vernünftige Parameteroptimierung und Risikomanagement stabile Handelswirkung erzielt werden.
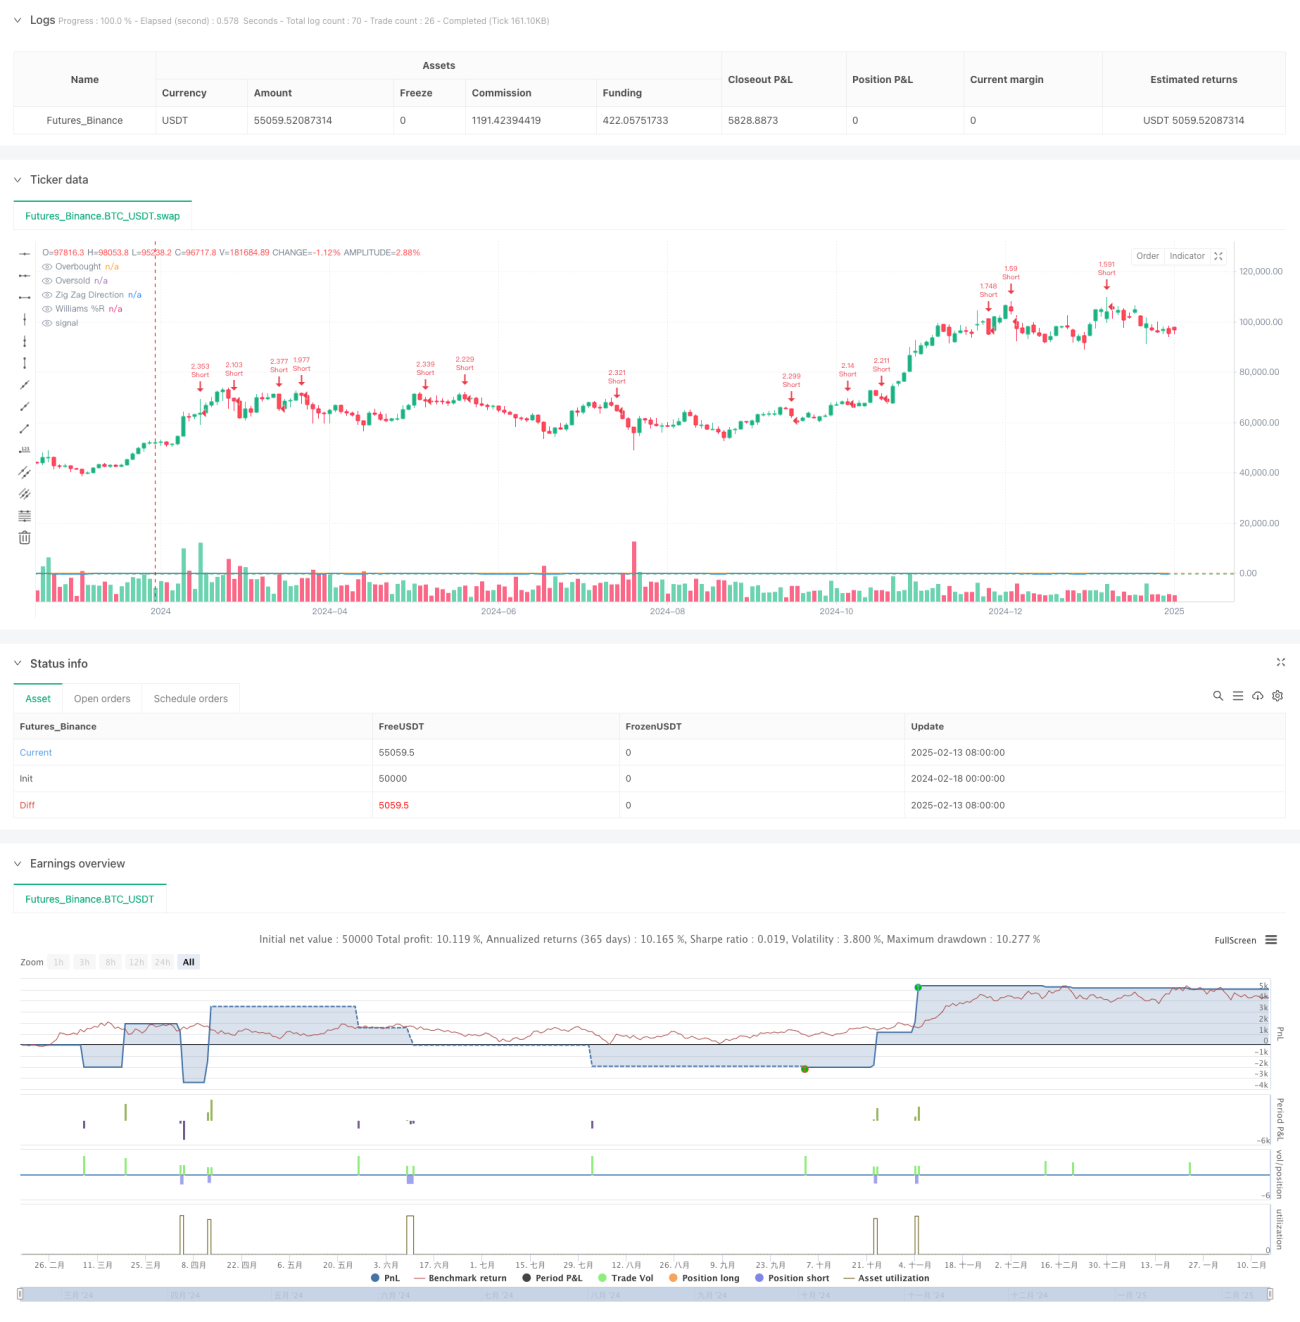
/*backtest
start: 2024-02-18 00:00:00
end: 2025-02-15 08:00:00
period: 2d
basePeriod: 2d
exchanges: [{"eid":"Futures_Binance","currency":"BTC_USDT"}]
*/

//@version=6
strategy("Zig Zag + Williams %R Strategy", overlay=true, default_qty_type=strategy.percent_of_equity, default_qty_value=300)

// ====================- 1