
Überblick
Es handelt sich um eine umfassende Handelsstrategie, die Brin-Band und Parallax-Linie-Wechsel-Indikator ((PSAR) kombiniert und mit einem festen Risiko-Gewinn-Verhältnis verwaltet wird. Die Strategie läuft hauptsächlich während des Tageshandels und identifiziert Handelschancen durch Preisbruch von Brin-Bändern und Graphik-Formaten, während die PSAR-Indikator zur Trendbestätigung verwendet wird. Die Strategie verwendet eine dynamische Stop-Loss- und Profit-Ziel-Einstellung, um ein Risiko-Gewinn-Verhältnis von 1:3 zu halten.
Strategieprinzip
Die Strategie verwendet mehrere technische Indikatoren für die Bestätigung von Handelssignalen:
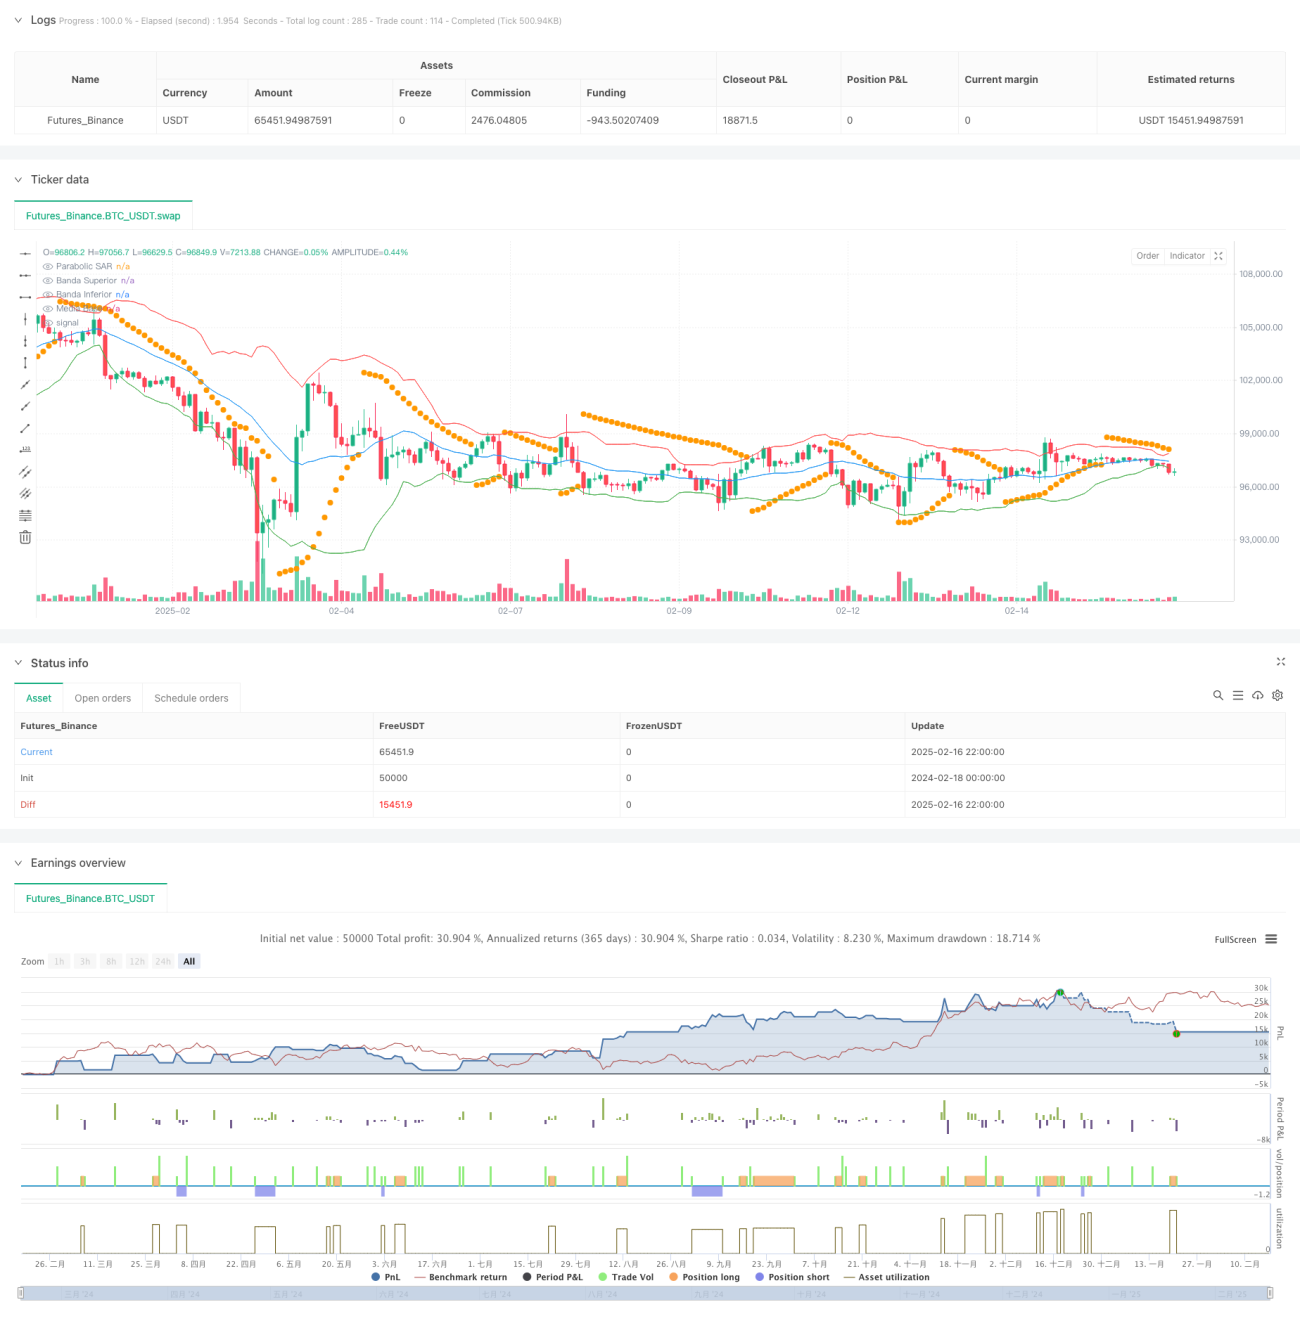
- Die Brin-Band mit 20 Zyklen als primärer Indikator für die Preisspanne
- Durch den PSAR-Indikator ((Anfangswert 0,02, Maximalwert 0,2) als Trendbestätigungsinstrument
- Berechnen Sie das Verhältnis der Kabelentität ((Länge der Entität / Gesamtlänge ≥ 0,33), um die Zuverlässigkeit des Signals zu gewährleisten
- Transaktionen innerhalb des angegebenen Handelszeitfensters (GMT-5 7:30-16:00) ausführen
- Mehrköpfige Einstiegsvoraussetzungen: Abschlusspreise brechen die Bahn und die Erfolgsquote erfüllt die Anforderungen
- Eintrittsvoraussetzungen: Eintrittsvoraussetzungen: Der Abschlusskurs ist ausgebrochen und die Erfolgsquote entspricht den Anforderungen
Strategische Vorteile
- Mehrfache technische Kennzahlen zur Verbesserung der Signalsicherheit
- Die Verwendung eines festen Risikoreductions (RRR) von 1: 3 ist für langfristige stabile Erträge geeignet.
- Filterung durch Zeit, um Störungen während der niedrigen Liquidität zu vermeiden
- Filterung mit enthaltensbezogener Proportion, um falsche Durchbrüche zu reduzieren
- Setzen Sie dynamische Stop-Loss- und Gewinnziele, um sich an Marktschwankungen anzupassen
- Die Strategie ist klar, leicht zu verstehen und zu optimieren.
Strategisches Risiko
- Ein möglicher Ausrutscher in einem hochschwankenden Markt
- Festgesetzte Risikogewinne im Vergleich zu möglicherweise verpassten Gewinnchancen
- Zeitfilter könnten wichtige Marktchancen verpassen
- Mehrere Anzeigen können zu Signalverzögerungen führen
- In einem turbulenten Markt kann es zu anhaltenden Verlusten kommen.
Richtung der Strategieoptimierung
- Einführung eines adaptiven Brin-Band-Zyklus zur Anpassung an unterschiedliche Marktumstände
- Risiken und Vorteile von dynamischen Entwicklungsmechanismen im Vergleich zu eingestellten Mechanismen
- Lautstärkeanzeige als Zusatzbestätigung hinzufügen
- Optimierung von PSAR-Parametern zur Verbesserung der Trendverfolgung
- Eintritt in den Marktfluktuationsfilter
- Entwickeln von intelligenten Zeitfiltern
Zusammenfassen
Die Strategie baut ein vollständiges Handelssystem auf, indem sie Brin-Bands, PSAR-Indikatoren und Graphik-Analysen kombiniert. Die Kernvorteile der Strategie liegen in der Synergie mehrerer technischer Indikatoren und einer strengen Risikomanagement. Obwohl einige inhärente Risiken bestehen, kann die Strategie durch die empfohlene Optimierungsrichtung die Stabilität und Profitabilität der Strategie weiter verbessern.
- 1