
Überblick
Diese Strategie ist ein Trendfolge-Handelssystem, das auf einem verbesserten Relative-Stärke-Index (RSI) basiert. Sie berechnet eine modifizierte Version des RSI und nutzt in Kombination mit dessen Signallinie Trendwende-Chancen in verschiedenen Marktzyklen. Die Strategie berechnet nicht nur die Indikatorwerte, sondern zeigt visuell überkaufte und überverkaufte Bereiche an, um Händlern eine intuitive Beurteilung des Marktzustands zu ermöglichen.
Strategieprinzip
Das Kernprinzip der Strategie besteht darin, Markttrends durch die Berechnung des Enhanced RSI (ARSI) zu identifizieren. Im Einzelnen umfasst dies:
- Berechnung der Höchst- und Tiefstkurse innerhalb eines bestimmten Zeitraums zur Bestimmung der Preisspanne
- Berechnung der Differenz basierend auf Preisänderungen
- Glättung der Differenz mit wählbaren gleitenden Durchschnittsmethoden (EMA, SMA, RMA, TMA)
- Normalisierung des Ergebnisses auf einen Bereich von 0–100
- Erzeugung von Long-Signalen, wenn der ARSI unter 50 die Signallinie von unten nach oben kreuzt
- Erzeugung von Short-Signalen, wenn der ARSI über 50 die Signallinie von oben nach unten durchbricht
Strategievorteile
- Solides Signalbestätigungssystem – Durch die Kreuzung von ARSI und Signallinie in Verbindung mit der Mittellinienfilterung wird die Zuverlässigkeit der Signale sichergestellt
- Hohe Anpassungsfähigkeit – Unterstützt mehrere gleitende Durchschnittsmethoden, die je nach Marktgegebenheiten angepasst werden können
- Angemessenes Risikomanagement – Verwendung einer positionsprozentualen Managementmethode zur effektiven Kontrolle des Risikos pro Trade
- Hervorragende Visualisierung – Durch Farbfüllungen werden überkaufte/überverkaufte Bereiche klar dargestellt, was eine schnelle Beurteilung ermöglicht
- Verwaltung gegenläufiger Positionen – Bei gegensätzlichen Signalen werden bestehende Positionen automatisch geschlossen, um das Risiko von Doppelpositionen zu vermeiden
Strategierisiken
- Seitwärtsmarktrisiko – In Seitwärtsbewegungen können häufige Fehlsignale auftreten
- Verzögerungsrisiko – Aufgrund der Verwendung gleitender Durchschnitte können Signale eine gewisse Verzögerung aufweisen
- Parameterempfindlichkeit – Unterschiedliche Parametereinstellungen können zu stark abweichenden Strategieleistungen führen
- Marktanpassungsrisiko – Die Performance der Strategie kann in verschiedenen Marktumgebungen erheblich variieren
- Geldmanagementrisiko – Eine feste prozentuale Positionsgrößenverwaltung kann bei hoher Volatilität zu erhöhten Risiken führen
Optimierungsmöglichkeiten der Strategie
- Einführung eines Volatilitätsfilters – Hinzufügen des ATR-Indikators zur Filterung von Handelssignalen in Umgebungen mit niedriger Volatilität
- Ergänzung um Trendbestätigungsindikatoren – Kombination mit längerfristigen Trendindikatoren zur Erhöhung der Signalzuverlässigkeit
- Optimierung des Positionsmanagements – Dynamische Anpassung der Positionsgröße basierend auf der Marktvolatilität
- Integration eines Stop-Loss-Mechanismus – Festlegung eines dynamischen Stop-Loss auf Basis des ATR zur besseren Risikokontrolle
- Entwicklung adaptiver Parameter – Erforschung dynamischer Optimierungsmethoden für Parameter zur Steigerung der Anpassungsfähigkeit
Zusammenfassung
Diese Strategie ist ein strukturiertes, logisch klares Trendfolge-System. Durch die innovative Berechnung des Enhanced RSI und die Kombination der Vorteile mehrerer technischer Indikatoren entsteht ein zuverlässiges Handelssystem. Trotz einiger inhärenter Risiken bietet die Strategie bei angemessener Optimierung und Risikomanagement gute Aussichten für den praktischen Einsatz. Händlern wird empfohlen, die Parametereinstellungen vor dem Live-Einsatz gründlich zu testen und die Strategiekonfiguration je nach Marktumgebung rechtzeitig anzupassen.
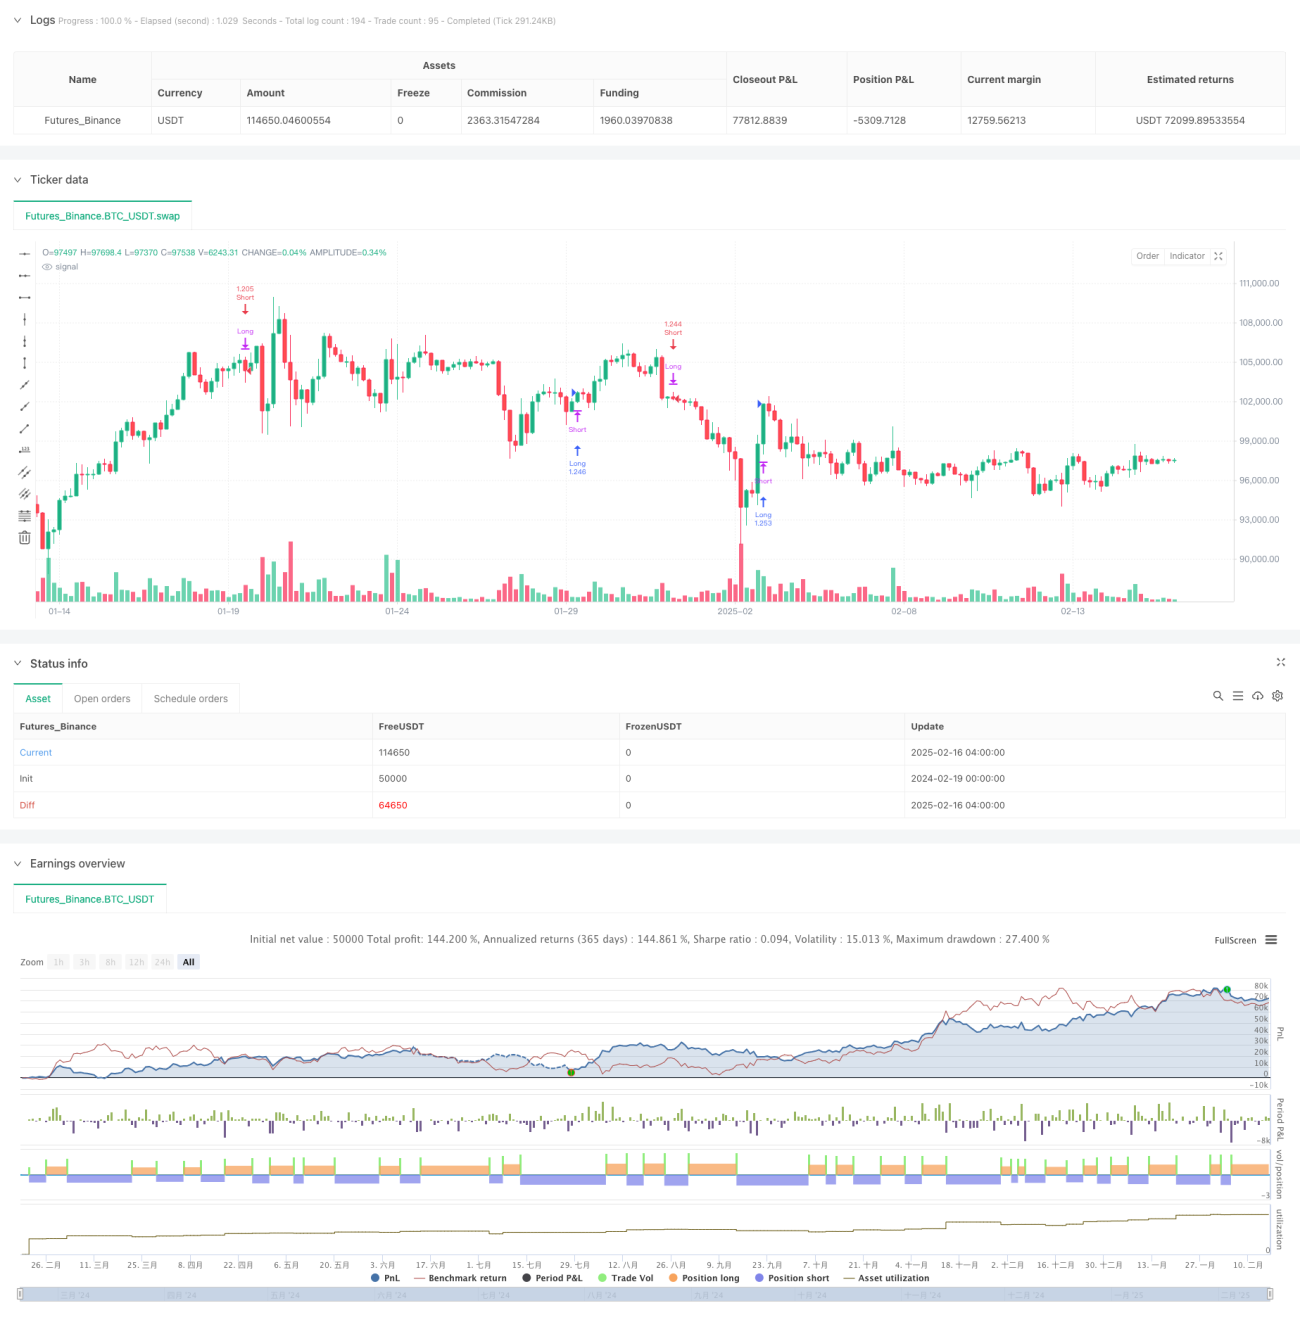
/*backtest
start: 2024-02-19 00:00:00
end: 2025-02-16 08:00:00
period: 4h
basePeriod: 4h
exchanges: [{"eid":"Futures_Binance","currency":"BTC_USDT"}]
*/

//@version=6
strategy("Ultimate RSI [LuxAlgo] Strategy", shorttitle="ULT RSI Strat", overlay=false, initial_capital=10000, currency=currency.USD, default_qty_type=strategy.percent_of_equity, default_qty_value=100)

//------------------------------------------------------------------------------- 1