
Überblick
Dies ist eine dynamische Bandbreite-Handelsstrategie, die auf mehreren technischen Indikatoren basiert und hauptsächlich die Merkmale von Trendverfolgung und Bandbreitenoperationen kombiniert. Die Strategie sucht nach hochwertigen Handelsmöglichkeiten in den Märkten durch die synchronische Zusammenarbeit von mehreren technischen Indikatoren wie EMA, ADX, RSI und MACD. Das System verwendet dynamische Stop-Loss- und Batch-Stop-Systeme, um Risiken und Gewinne zu verwalten.
Strategieprinzip
Die Kernlogik der Strategie basiert auf folgenden Schlüsselelementen:
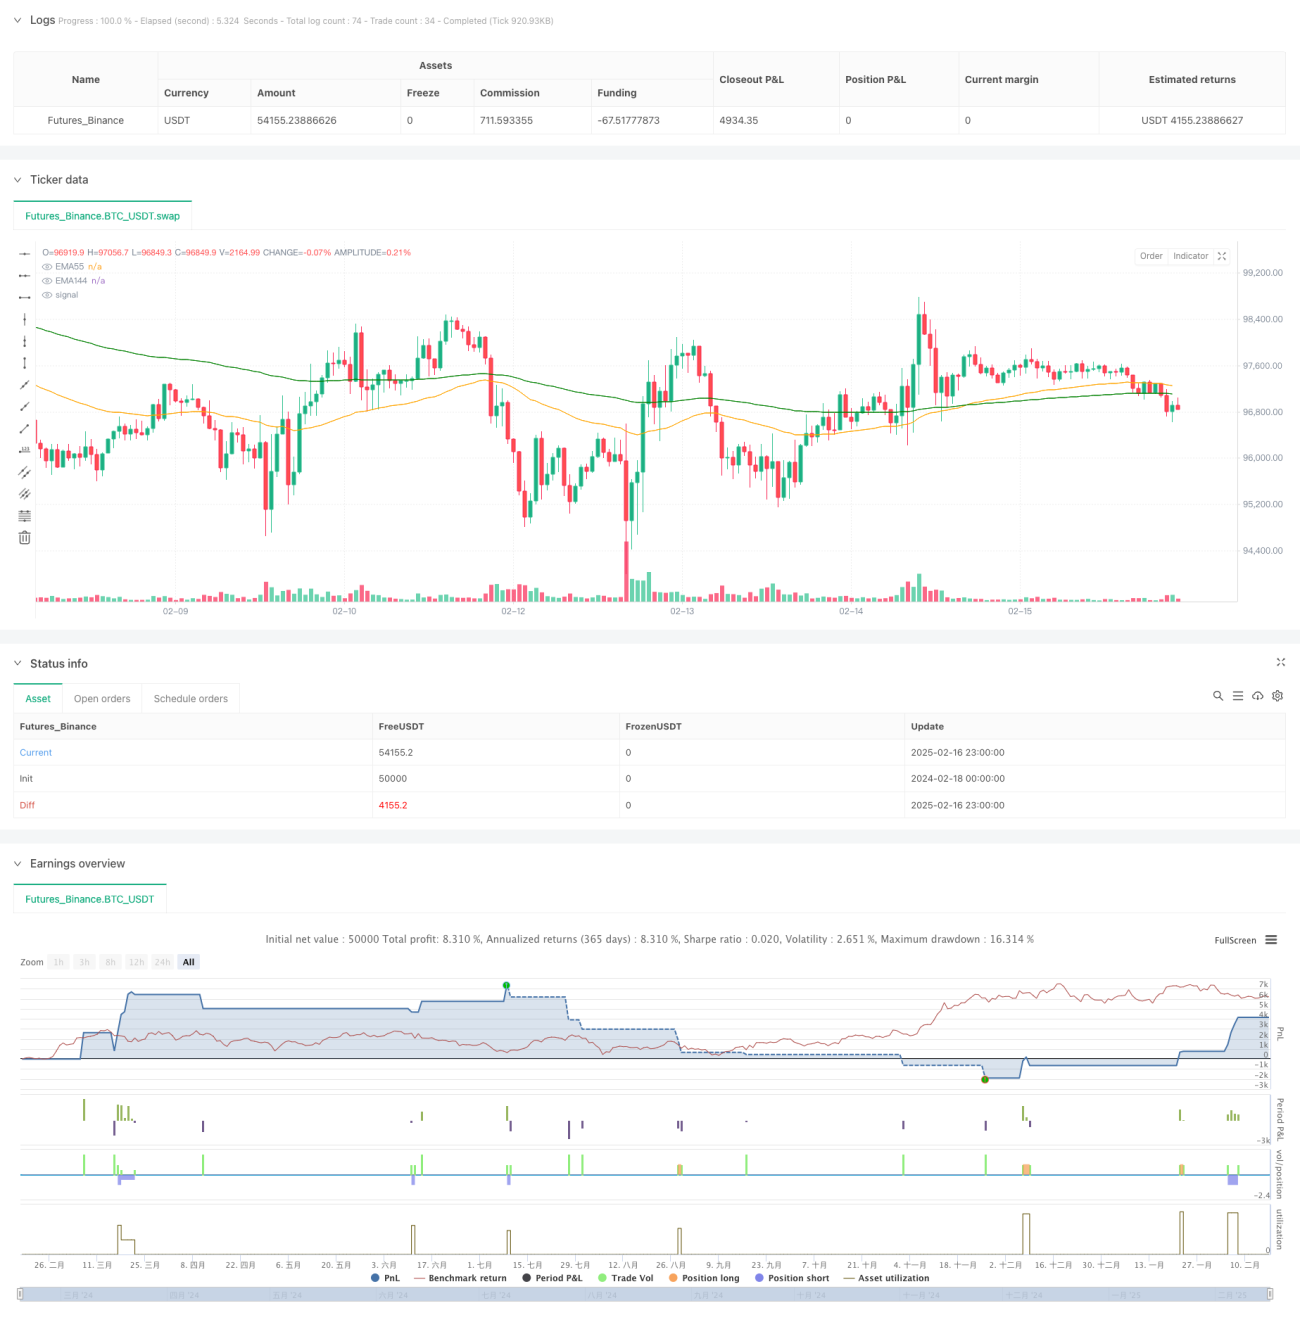
- Trendbeurteilung: Die Kreuzung von EMA55 und EMA144 wird verwendet, um die Richtung des Markttrends zu bestimmen, und die Trendbestätigung wird in Verbindung mit der ADX-Indikatorstärke ((Trench 30) durchgeführt.
- Eintrittszeiten: Überkauf-Überverkaufszonen werden durch den RSI-Indikator ((Überverkauf 45, Überkauf 55) identifiziert, um Rückkauf- und Rebound-Deflation-Möglichkeiten zu ermitteln.
- Stop-Loss-Mechanismus: Dynamischer Stop-Loss auf Basis des ATR mit einem Stop-Loss-Abstand von 1,5 mal ATR, der sich an Marktschwankungen anpassen lässt.
- Gewinnstrategie: Verwendung von 50-Zyklus-Höchst-/Tiefstpreisen als Stop-Off-Ziel, wobei die Stop-Off-Methode auf 50% der Positionen verteilt wird.
Strategische Vorteile
- Multi-Indicator-Verifizierung: Die Verwendung von mehreren Indikatoren wie EMA, ADX und RSI erhöht die Zuverlässigkeit der Handelssignale.
- Dynamisches Risikomanagement: Das ATR-basierte dynamische Stop-Loss kann sich an unterschiedliche Marktbedingungen anpassen und bietet eine bessere Risikokontrolle.
- Progressive Gewinnspanne: Durch die Verwendung von Bündel-Stopp-Methoden kann ein Teil des Gewinns gesperrt werden, ohne dass ein vorzeitiger Ausstieg aus einem starken Markt möglich ist.
- Trendbestätigung: Ein ADX-Filter wird verwendet, um den häufigen Handel in schwankenden Märkten zu vermeiden.
Strategisches Risiko
- Gefahr eines falschen Durchbruchs: Bei starker Marktschwankung kann es zu Fehleinschätzungen kommen, es wird empfohlen, die Bestätigung der Transaktionen zu erhöhen.
- Schlupflose: Bei schnellen Marktschwankungen kann ein dynamischer Stop-Loss einen größeren Schlupflose erleiden.
- Verlust am Horizont: Trotz der ADX-Filterung kann es zu kleinen Verlusten in einem schwankenden Markt kommen.
- Signalverzögerung: Eine Kombination aus mehreren Indikatoren kann dazu führen, dass das Einstiegssignal verzögert wird und der optimale Zeitpunkt für die Positionierung verpasst wird.
Richtung der Strategieoptimierung
- Optimierung der Indikatorparameter: Es wird empfohlen, die EMA-Zyklen, die RSI-Schwellen und andere Parameter zu optimieren.
- Stop-Loss-Optimierung: Erhöhung der mobilen Stop-Loss kann in Betracht gezogen werden, um die Gewinne besser zu schützen.
- Positionsverwaltung: Es wird empfohlen, ein Positionsverwaltungssystem einzuführen, das sich an die Volatilität anpasst.
- Marktanpassungsfähigkeit: Marktregierungen können hinzugefügt werden, wobei verschiedene Kombinationen von Parametern unter verschiedenen Marktbedingungen verwendet werden.
Zusammenfassen
Die Strategie arbeitet mit mehreren technischen Kennzahlen zusammen und baut ein vollständiges Handelssystem auf. Die Strategie konzentriert sich sowohl auf die Erfassung von Trends als auch auf die Risikokontrolle, indem sie Risiken und Gewinne durch dynamische Stop-Loss- und Batch-Stopp-Methoden ausgleicht. Obwohl es einige Optimierungsmöglichkeiten gibt, ist es insgesamt eine logisch strenge und praktische Handelsstrategie.
- 1