Mehrere Indikatoren kreuzen dynamische, adaptive Trendverfolgungs-Handelsstrategie

Überblick
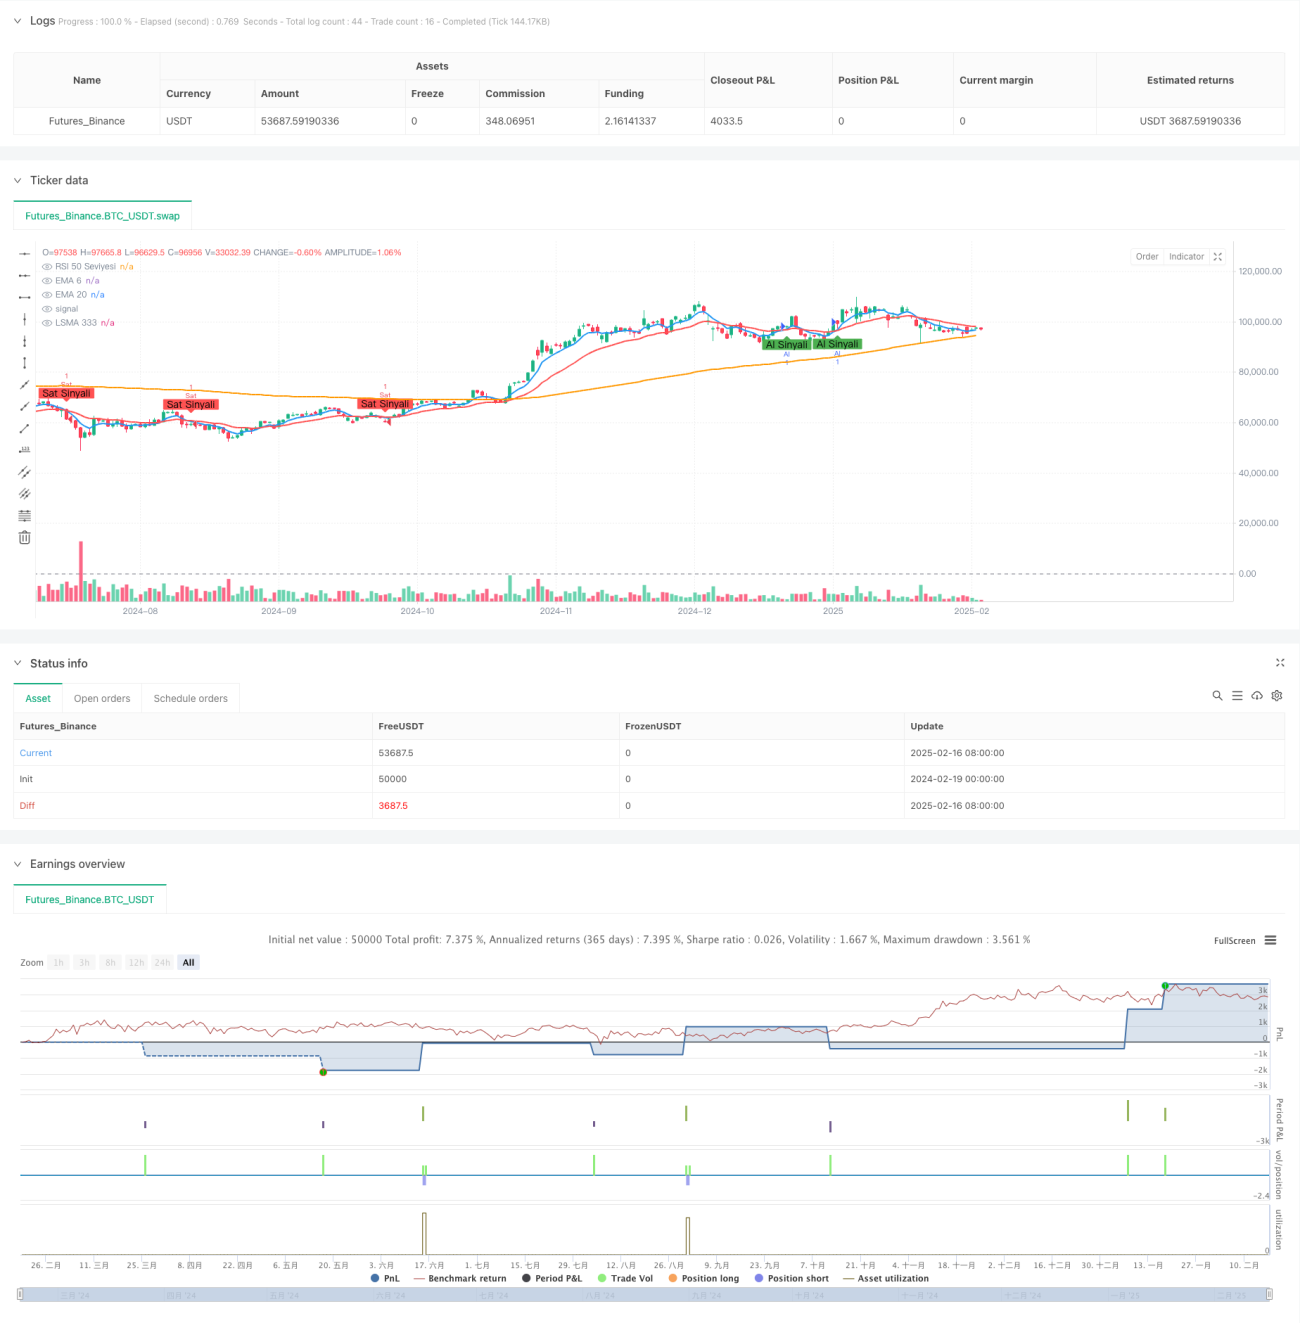
Die Strategie basiert auf einem Trend-Tracking-System, das auf einer Kreuzung von mehreren technischen Indikatoren basiert und die drei Indikatoren EMA, LSMA und RSI kombiniert, um Handelschancen durch mehrere Signalbestätigungen zu filtern. Die Strategie verwendet einen adaptiven Stop-Loss-Mechanismus, der die Risikomanagementparameter an die dynamischen Marktentwicklungen anpasst.
Strategieprinzip
Die Kernlogik der Strategie umfasst folgende Aspekte:
- Kurz- und Langzeite-EMA (6) werden verwendet, um Trendwendepunkte zu erfassen
- Die Verwendung von LSMA ((333) als langfristiger Trendbestätigungsindikator
- Der 50-Grenze des RSI ((14) als Maßstab für die Marktstärke
- Der Betrag, der für die Eröffnung einer Überlagerung erforderlich ist, ist der folgende:
- EMA20 auf EMA6
- Der Preis liegt über der LSMA333.
- Der RSI ist größer als 50.
- Sie können auch eine leere Position eröffnen, wenn die folgenden Bedingungen erfüllt sind:
- EMA 20 unter EMA 6
- Preise unter LSMA333
- RSI kleiner als 50
Strategische Vorteile
- Mehrfache Kennzahlen, die die Auswirkungen von Falschmeldungen erheblich reduzieren
- Kombination von Trend-Tracking und Dynamometer erhöht die Signalsicherheit
- Anpassung der Stop-Loss-Mechanismen, die flexibel an die Marktbedingungen angepasst werden können
- Die Strategielogik ist klar und die Parameter sind hochgradig anpassbar
- Mehrfache Analyse der Märkte erhöht die Erfolgsquote
Strategisches Risiko
- In volatilen Märkten können häufig Fehlsignale auftreten
- Mehrere Indikatoren könnten bestätigen, dass der Zeitpunkt des Beitritts leicht verzögert ist
- Feste prozentuale Stop-Loss- und Take-Profit-Bestimmungen sind möglicherweise nicht für alle Marktbedingungen geeignet.
- Übermäßige Parameteroptimierung kann zu Überanpassung führen
- Es ist möglich, dass man einige Handelschancen bei schnellen Märkten verpasst.
Richtung der Strategieoptimierung
- Einführung von Volatilitätsindikatoren zur dynamischen Anpassung der Stop-Loss-Ratio
- Erhöhung der Analyse der Transaktionen zur Bestätigung der Effektivität von Trends
- Erwägen Sie, ein Klassifizierungssystem für die Marktumgebung hinzuzufügen, das verschiedene Parameter für verschiedene Marktbedingungen verwendet
- Anpassungsmechanismen zur Optimierung der Kennzahlenparameter
- Erweiterte Positionsabwicklung für eine flexiblere Positionskontrolle
Zusammenfassen
Die Strategie baut durch die kombinierte Verwendung von mehreren technischen Indikatoren ein relativ robustes Trend-Tracking-System auf. Die Kernvorteile der Strategie liegen in der Zuverlässigkeit der Signalbestätigung, aber auch in der Anpassungsfähigkeit in verschiedenen Marktumgebungen. Durch kontinuierliche Optimierung und Verbesserung wird die Strategie in der Lage sein, im realen Handel besser zu funktionieren.
- 1