
Überblick
Die Strategie ist ein durchschnittlich rückläufiges Handelssystem, basierend auf Pivot Points. Sie bestimmt die Ein- und Ausgänge durch die Berechnung von Unterstützungsschwellen (S1-S4) und Widerstandsschwellen (R1-R4) pro Woche. Die Strategie verwendet eine stufenweise Positionserstellung, bei der mehrere Käufe an verschiedenen Unterstützungsstellen getätigt werden und die entsprechenden Widerstandsschwellen profitiert werden.
Strategieprinzip
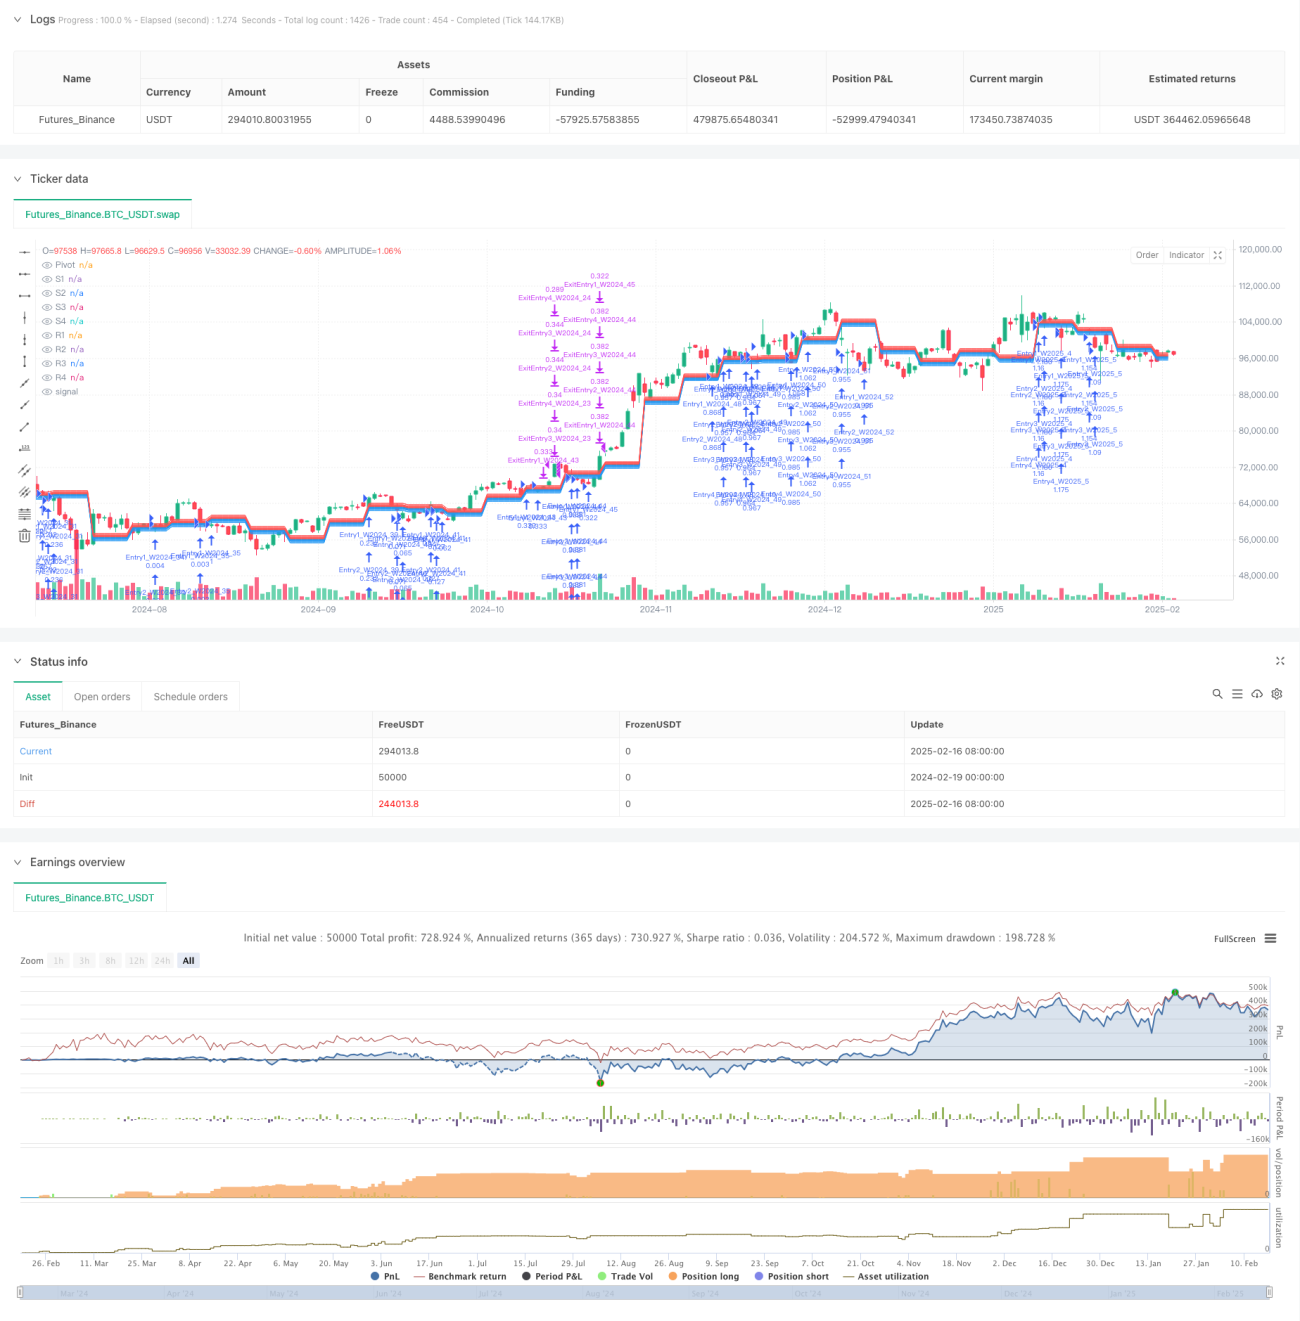
Der Kern der Strategie besteht darin, die Pivot-Punkte der Woche zu berechnen, indem man die Höchst- und Tiefstpreise sowie die Schlusskosten der vergangenen Woche berechnet, und dann mehrere Unterstützungs- und Widerstandspunkte zu ermitteln, die auf der Grundlage der vorgegebenen Punktabstände liegen. Kaufen Sie, wenn der Preis die Unterstützung erreicht, und setzen Sie ein Gewinnziel für die entsprechende Widerstandspunkt.
Pivot = (höchster Preis der letzten Woche + niedriger Preis der letzten Woche + Abschlusspreis der letzten Woche) / 3
Die Strategie erlaubt bis zu 4 Positionen gleichzeitig zu halten, wobei jede Position unterschiedlichen Unterstützungs- und Widerstandspositionen entspricht. Alle Positionen berechnen zu Beginn jeder Woche neue Handelsniveaus. Diese Konstruktion gewährleistet sowohl die Kontinuität des Handels als auch die Anpassung an Veränderungen des Marktes.
Strategische Vorteile
- Die Transaktionslogik ist klar, leicht zu verstehen und auszuführen
- Die Schritt-in-Schritt-Aufbau-Methode reduziert die Risiken bei einem einzigen Handel
- Nutzung von Widerstandspunkten auf Umkreisebene, um die Auswirkungen von Tageslärm zu reduzieren
- Die Strategie kann die Parameter flexibel an unterschiedliche Marktmerkmale anpassen
- Risikokontrolle durch Prozentsatz der Positionen
- Keine Zeit für die Einführung von Schlichtungsbeschränkungen, um den Devisen genügend Spielraum zu geben.
Strategisches Risiko
- Keine Stop-Loss-Einstellung, die zu einem größeren Rückzug in einem stark trendigen Markt führen kann
- Mehrere Positionen können mehr Geld in Anspruch nehmen
- Falsche Signale können in hochschwingenden Märkten auftreten
- Unzureichende Stützpunkte können zu unvernünftigen Lagerpositionen führen.
Um das Risiko zu verringern, wird empfohlen, einen Trendfilter hinzuzufügen und nur im Aufwärtstrend zu handeln; außerdem kann ein dynamischer Stop-Loss auf Basis von ATR eingestellt werden.
Richtung der Strategieoptimierung
- Erhöhung der Mengenbestätigungsmechanismen und der Zuverlässigkeit der Eingangssignale
- Technische Indikatoren wie den RSI einführen, um Überkauf und Überverkauf zu filtern
- Entwicklung von Mehrzeitbestätigungsmechanismen zur Verringerung von Falschsignalen
- Optimierung des Positionsmanagementsystems und Anpassung der Lagerbestände an die Marktentwicklung
- Erhöhung der Korrelationsanalyse, um die gleichzeitige Positionierung in hochkorrelativen Märkten zu vermeiden
Zusammenfassen
Es handelt sich um eine auf klassischen Theorien der technischen Analyse basierende Mean-Return-Strategie, bei der Handelschancen durch Durchbruchrückgänge an Widerstandspunkten, die durch die Umlauflinie unterstützt werden, erfasst werden. Die Strategie ist schlicht und elastisch ausgelegt und eignet sich für die Anwendung in stark volatilen Märkten. Durch eine vernünftige Parameteroptimierung und Risikomanagement kann die Strategie eine stabile Leistung in verschiedenen Marktumgebungen aufrechterhalten.
- 1