
Überblick
Die Strategie identifiziert potenzielle Handelschancen durch die Analyse von Chartformationen und Preisspanen in höheren Zeiträumen. Die Strategie integriert einen Transitvolumenfilter und eine dynamische Stop-Loss-Mechanik, um Trendchancen durch Durchbrüche von vorherigen Höhen und Tiefen zu erfassen.
Strategieprinzip
Der Kern der Strategie besteht darin, die Preise zu überschreiten, wenn sie in einem höheren Zeitrahmen (die Standardzeit ist 4 Stunden) brechen.
- Die Strategie verfolgt und speichert fortlaufend die Höhen und Tiefen der beiden vorherigen K-Linien mit hohen Zeiträumen
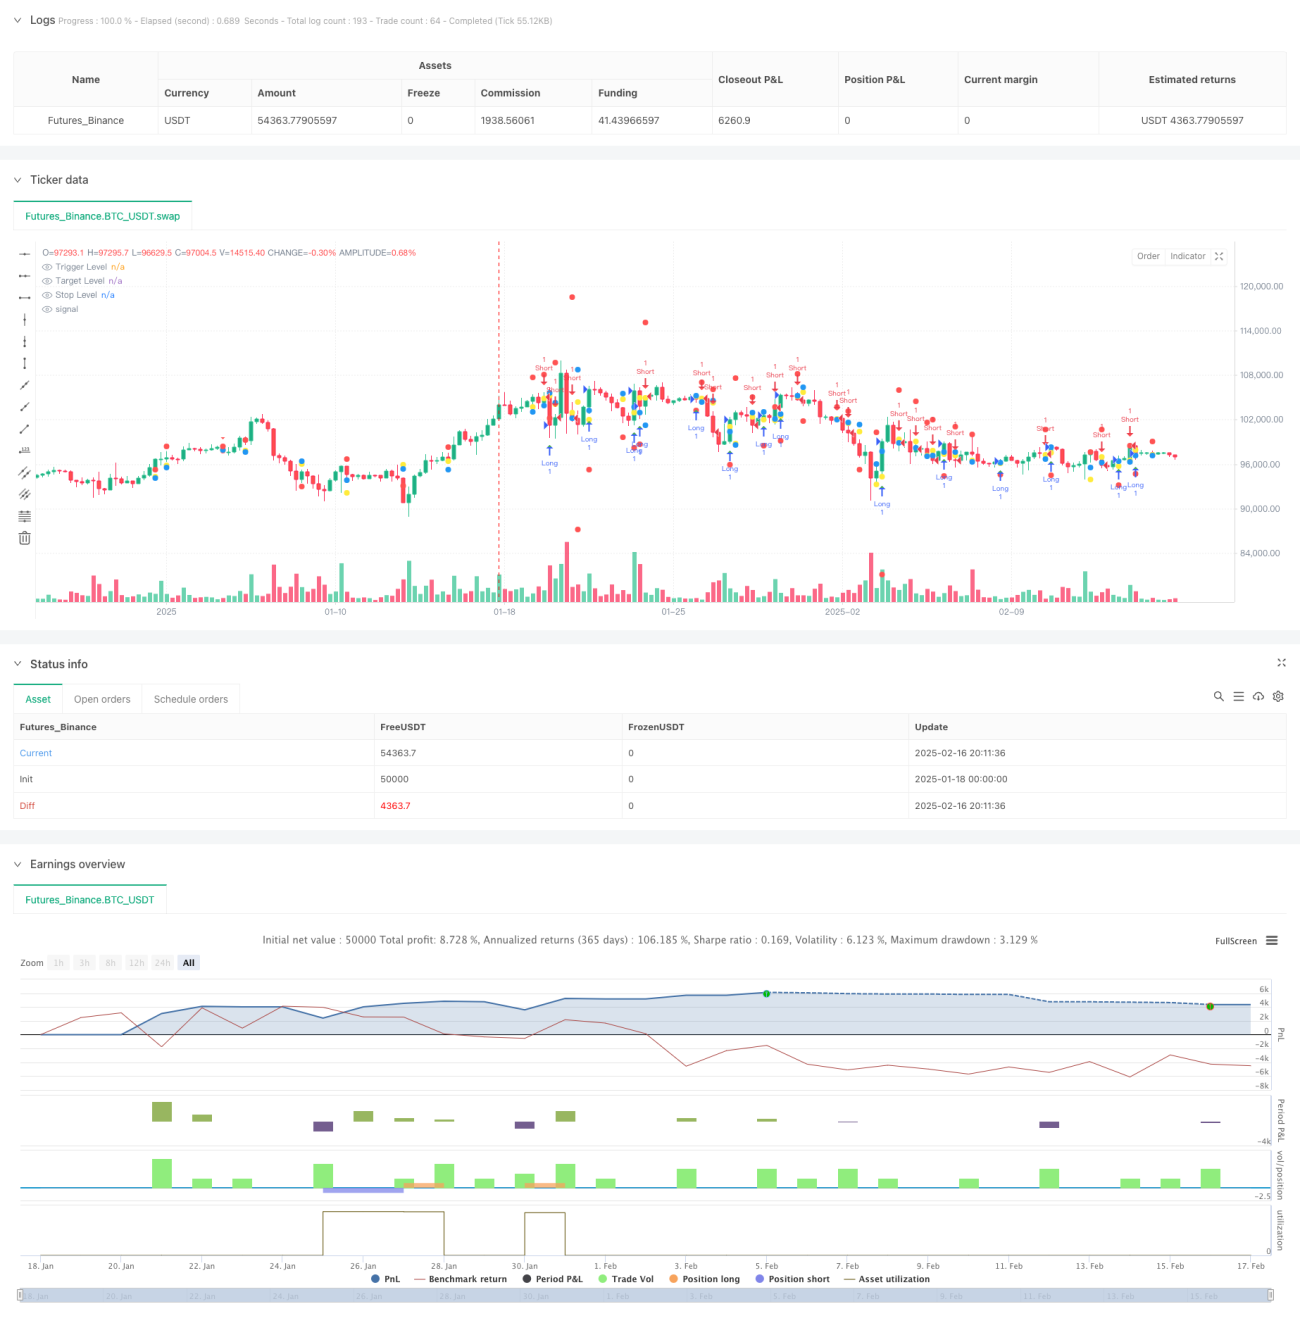
- Wenn der aktuelle K-Linie-Abschlusspreis unter dem vorherigen Hoch liegt und der aktuelle K-Linie-Innovationshoch, wird ein Shorting-Signal erzeugt
- Wenn ein aktueller K-Line-Knallpreis höher ist als ein früherer niedriger und die aktuelle K-Line-Innovation niedrig ist, wird ein Mehrwertsignal erzeugt
- Eintrittspreise werden an den Höhe- und Tiefpunkten der ausgelösten K-Linie festgelegt
- Die Gewinnziele sind in den entsprechenden Höhen- und Tiefpunkten der Vorphase gesetzt
- Die Stop-Loss-Distanz wird dynamisch angepasst, je nach Bandbreite
Strategische Vorteile
- Mehrzeit-Perioden-Analysen liefern zuverlässigere Signale
- Dynamische Stop-Loss-Einstellungen, die sich an Marktschwankungen anpassen
- Optionale Transaktionsvolumenfilter erhöhen die Bestätigung der Transaktion
- Klare visuelle Oberfläche, einschließlich Markierung von Triggerpreisen, Zielpreisen und Stop Losses
- Die Strategie ist einfach, klar und leicht zu verstehen und umzusetzen.
- Anwendbar für verschiedene Handelsarten und Marktbedingungen
Strategisches Risiko
- Häufige falsche Durchbruchsignale bei Zwischenbewegungen
- Eine größere Stop-Loss-Multiplikation kann zu einem zu hohen Einmalverlust führen
- Abhängigkeit von historischen Preisdaten, die in einem sich schnell verändernden Marktumfeld zurückbleiben können
- Der Einfluss grundlegender Faktoren wurde nicht berücksichtigt.
- In weniger liquiden Märkten kann dies schwierig sein.
Richtung der Strategieoptimierung
- Einführung von Trendfiltern wie Moving Averages oder ADX-Indikatoren
- Mehr Kriterien für die Marktumgebung
- Optimierung der Stop-Loss-Strategie und Erwägung der Einführung eines mobilen Stop-Losses
- Hinzufügen eines Moduls zur Verwaltung von Transaktionsvolumen
- Erwägen Sie, mehr Zeitzyklus-Kopplungsanalysen hinzuzufügen
- Einführung von Volatilitätsindikatoren zur Optimierung der Bandbreite
Zusammenfassen
Es handelt sich um eine strukturierte, logisch klare, mehrzeitige Handelsstrategie. Sie sucht nach potenziellen Trendchancen durch die Analyse des Preisverhaltens in höheren Zeitzyklen und integriert Risikomanagement und Filtermechanismen. Die Kernvorteile der Strategie liegen in ihrer Anpassungsfähigkeit und Skalierbarkeit, die sich an unterschiedliche Marktumgebungen anpassen können, indem sie mit einfachen Parameteranpassungen angepasst werden.
- 1