Dynamisches Volumen, gleitender Durchschnitt, Trendfolge und HLCC4-Breakout-Handelsstrategie

Überblick
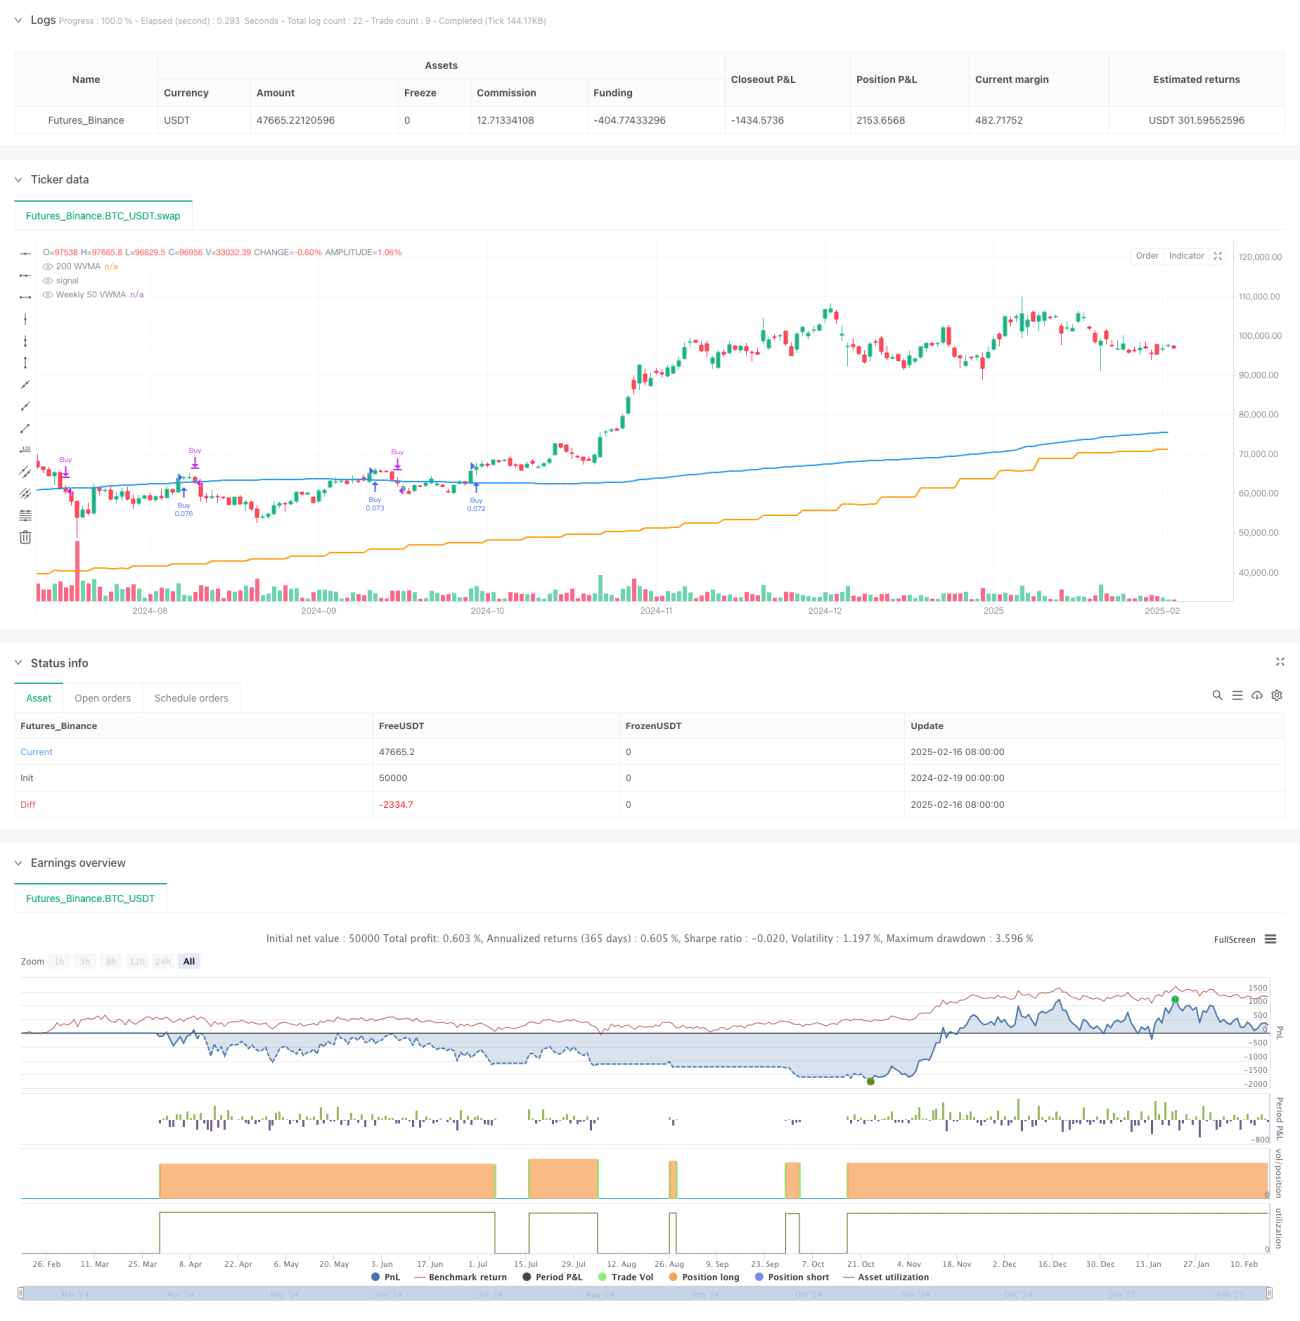
Die Strategie ist ein auf mehreren Zeiträumen basierendes Trend-Tracking-System, das den umlaufenden 50-Zyklus-Transaktions-Wertgewichteten Moving Average (VWMA) als Großtrend-Filter kombiniert und die 200-Zyklus-VWMA und HLCC4-Preis-Breakout des aktuellen Zeitraums als spezifische Handelssignale verwendet. Es ist eine Strategie, die nur mehr tut, um die Zuverlässigkeit des Handels durch strenge Trendbestätigung und mehrere Zeiträume zu erhöhen.
Strategieprinzip
Die Kernlogik der Strategie umfasst folgende Schlüsselbereiche:
- Die Verwendung der 50-periodischen VWMA als Maßstab für den Trend ist nur dann zulässig, wenn der Preis über dieser Durchschnittslinie liegt.
- Eintrittsvoraussetzungen sind die Erfüllung von zwei aufeinanderfolgenden K-Linie Schließung Preise sind über 200-Perioden-VWMA, und die zweite K-Linie Schließung Preise sind höher als die erste K-Linie HLCCC4-Durchschnittspreis.
- Die Ausstiegssignale basieren auf der Tageslinie und werden platziert, wenn der Tageslinie-Abschlusspreis unter der Tageslinie 200-Perioden-VWMA fällt.
- Die Strategie basiert auf der Verwaltung von festen Positionen, bei denen 10% der Kontogewinnanteile für jeden Handel verwendet werden.
- Die Wochenfrist wird in den letzten 5 Jahren überprüft, um die Effektivität der Strategie im aktuellen Marktumfeld sicherzustellen.
Strategische Vorteile
- Mehrfache Zeitzyklus-Verifizierung: Durch die Kombination von Kreis- und Tageszeilen können Sie sowohl die großen Trends erfassen als auch auf Marktveränderungen reagieren.
- Risikokontrolle: Die Verwendung von VWMA als Ersatz für einfache Moving Averages kann die tatsächliche Entwicklung des Marktes besser widerspiegeln.
- Die Trendbestätigung ist streng: Es werden mehrere Bedingungen gleichzeitig erfüllt, um zugelassen zu werden, wodurch das Risiko eines falschen Durchbruchs verringert wird.
- Positionsverwaltung ist vernünftig: Die Positionsverwaltung mit festen Anteilen kontrolliert sowohl das Risiko als auch den Gewinnraum.
- Hohe Automatisierungsstufe: Die Strategie ist klar und kann vollständig automatisiert werden.
Strategisches Risiko
- Risiko einer Trendwende: Bei starken Marktschwankungen kann es zu einem starken Rückzug kommen.
- Der Effekt von Slippoints: Bei mangelnder Marktliquidität kann der tatsächliche Handelspreis von dem theoretischen Preis abweichen.
- Signalverzögerung: Aufgrund der Verwendung eines mittleren Linien mit längeren Perioden kann die Strategie an Trendwendepunkten relativ spät reagieren.
- Gefahr eines falschen Einbruchs: Es besteht die Möglichkeit, dass ein falscher Einbruch verursacht Verluste, obwohl es mehrfach bestätigt wurde.
- Einseitige Handelsbeschränkung: Die Strategie ist nur zu viel zu tun und verpasst potenzielle Shorting-Möglichkeiten im Abwärtstrend.
Richtung der Strategieoptimierung
- Dynamische Parameter-Optimierung: Die Periodenparameter des VWMA können automatisch an die Marktschwankungen angepasst werden.
- Optimierung der Positionsverwaltung: Einführung eines dynamischen Positionsmanagementsystems, das auf Volatilität basiert.
- Verbesserte Ausstiegsmechanismen: Bewegliche Stopps oder dynamische Stopps basierend auf technischen Kennzahlen können hinzugefügt werden.
- Erhöhung der Marktstimmung: Verbunden mit Indikatoren wie dem RSI oder MACD erhöht sich die Zuverlässigkeit der Signale.
- Einführung von Transaktionsvolumenanalyse: Vertiefung der Analyse von Transaktionsvolumen und Optimierung der VWMA-Berechnungsmethoden.
Zusammenfassen
Es handelt sich um eine Strategie, die auf eine strenge Trendverfolgung ausgerichtet ist und durch die Kombination von mehreren Zeiträumen und strengen Handelsbedingungen eine bessere Risikokontrolle ermöglicht. Die Kernvorteile der Strategie liegen in ihren ausgefeilten Trendbestätigungsmechanismen und klaren Handelslogiken, die geeignet sind, mittelfristige Trendchancen in starken Märkten zu ergreifen.
/*backtest
start: 2024-02-19 00:00:00
end: 2025-02-17 00:00:00
period: 1d
basePeriod: 1d
exchanges: [{"eid":"Futures_Binance","currency":"BTC_USDT"}]
*/

//@version=6
strategy("Long-Only 200 WVMA + HLCC4 Strategy (Weekly 50 VWMA Filter, Daily Exit, Last 5 Years)", overlay=true, default_qty_type=strategy.percent_of_equity, default_qty_value=10)

// Parameters- 1