Dynamische Multi-Indikator-Trend-Crossover-Strategie für quantitatives Trading

Überblick
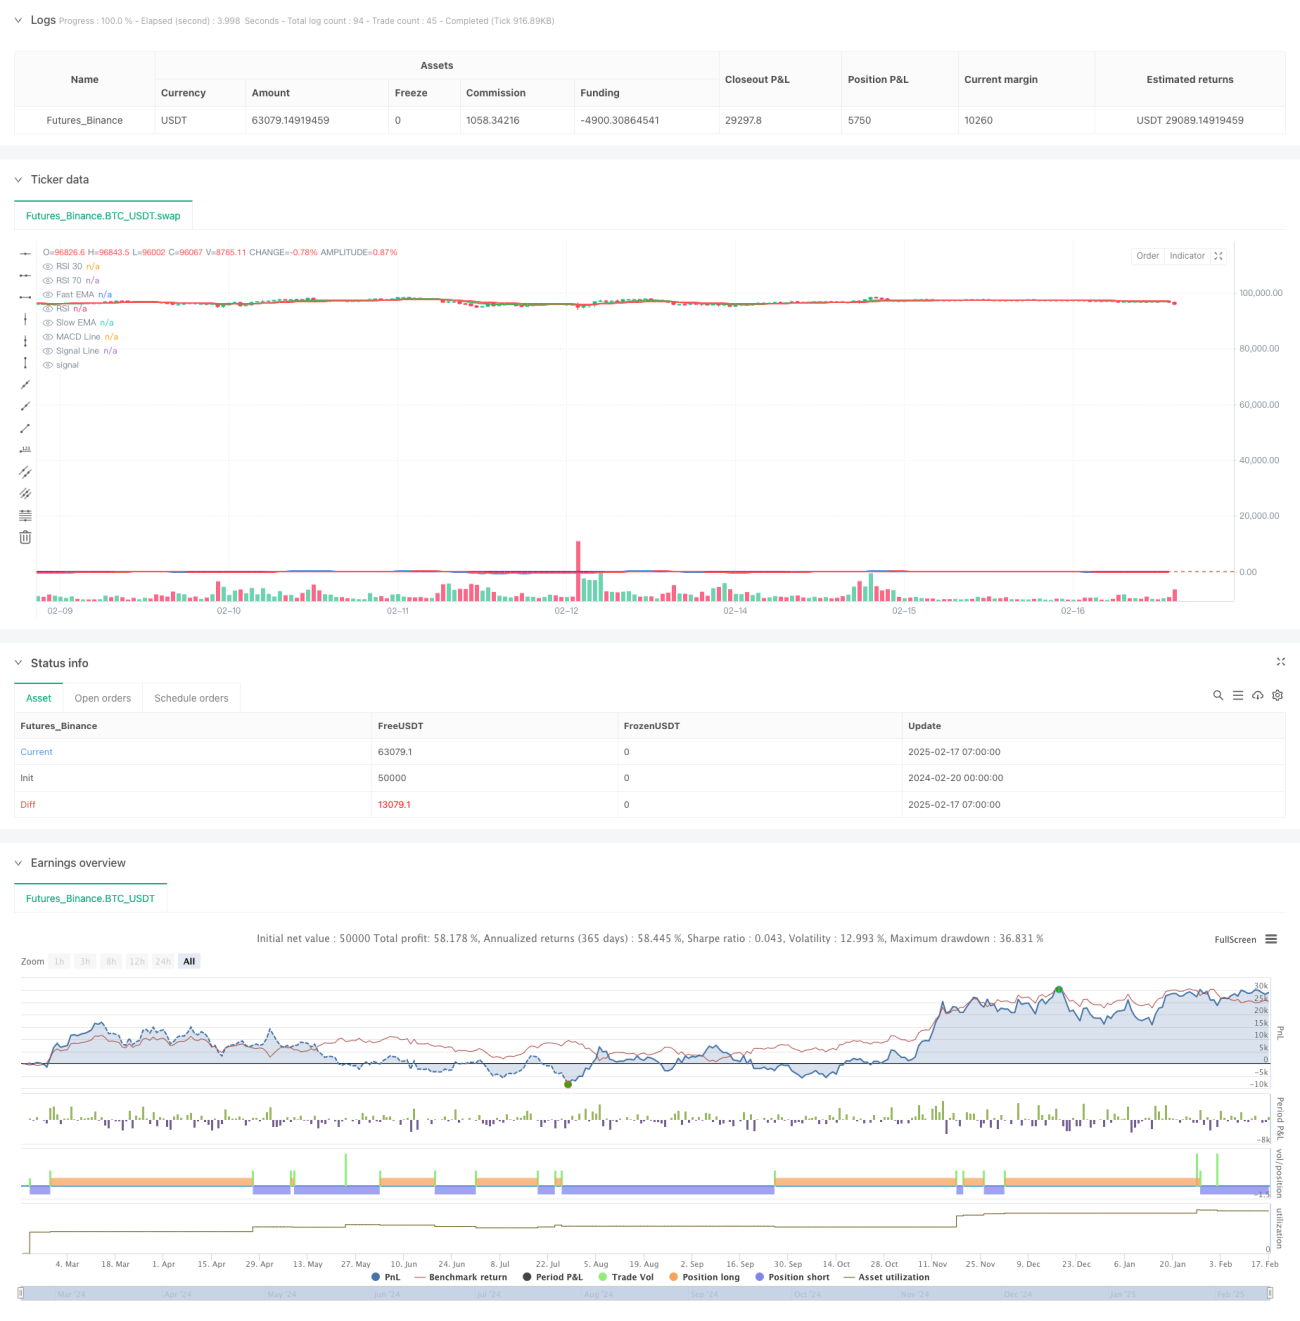
Die Strategie ist ein auf mehreren technischen Indikatoren basierendes Trend-Tracking-Trading-System, das drei klassische technische Indikatoren kombiniert: den Moving Average (EMA), den Moving Average Convergence (MACD) und den Relativ Strong Indicator (RSI), um durch die Erfassung von Markttrendänderungen und -dynamik zu handeln. Die Strategie verwendet ein Parameter-Set wie schnelle EMA (Zyklus 9) und langsame EMA (Zyklus 21), MACD (Zyklus 12, 26, 9) und RSI (Zyklus 14), um ein Handelssignal zu senden, wenn der Indikator überschreitet und die Schwelle überschreitet.
Strategieprinzip
Die Kernlogik der Strategie ist die Identifizierung von Wendepunkten in Markttrends durch die synchronisierte Bestätigung von mehreren technischen Indikatoren. Die Signalbestätigung umfasst die folgenden drei Aspekte:
- EMA-Kreuzsignal: Ein schneller EMA wird als Multi-Signal betrachtet, wenn er aufwärts durch einen langsameren EMA fährt, und ein unterwärts durchgehender EMA wird als Abstandssignal betrachtet.
- MACD-Kreuzsignal: Die MACD-Linie bestätigt den Plus, wenn sie die Signallinie nach oben durchquert, und bestätigt den Minus, wenn sie nach unten durchquert.
- RSI-Filter: Der RSI-Wert ist zwischen 30 und 70 zulässig, um zu vermeiden, dass übertrieben überkauft wird.
Die Strategie führt die entsprechenden Handelsoperationen nur aus, wenn drei Indikatoren gleichzeitig ein Gleichgewichtssignal erzeugen.
Strategische Vorteile
- Multi-Meter-Cross-Verifizierung, um die Auswirkungen von Falschmeldungen wirksam zu reduzieren.
- In Kombination mit Trend-Tracking und Dynamik-Indikatoren kann man die Wendepunkte des Marktes genauer erfassen.
- Die RSI-Filtermechanismen verhindern, dass übertrieben überverkaufte Zonen gehandelt werden.
- Die Strategie ist klar und lässt sich leicht anpassen.
- Es ist möglich, gleichzeitig mehr und weniger zu handeln, um sich an unterschiedliche Marktbedingungen anzupassen.
Strategisches Risiko
- Mehrfache Kennzahlen können dazu führen, dass das Signal verzögert wird und die beste Einstiegszeit verpasst wird.
- In schwankenden Märkten kann es zu häufigen Kreuzungen kommen, was die Kosten erhöht.
- Der festgelegte RSI-Threshold ist unter Umständen nicht flexibel genug für unterschiedliche Marktbedingungen.
- Es gibt keine Stop-Loss- und Stop-Stop-Mechanismen, die bei starken Schwankungen zu größeren Verlusten führen können.
- Die Auswahl der Parameter für die Technischen Kennzahlen muss durch ausreichende historische Daten verifiziert werden.
Richtung der Strategieoptimierung
- Einführung von selbst angepassten Kennzahlenparametern, die sich dynamisch an die Marktfluktuation anpassen.
- Ein Stop-Loss-Stopp-Mechanismus wurde hinzugefügt, um das Risiko eines einzelnen Handels zu kontrollieren.
- Erhöhung der Validierung von Transaktionsindikatoren und Signalsicherheit.
- Entwicklung von Modulen zur Identifizierung von Marktumgebungen, die verschiedene Handelsparameter in verschiedenen Marktzuständen verwenden.
- Einführung eines Moduls für die Vermögensverwaltung, um die Positionsgröße an die Risikodynamik des Kontos anzupassen.
- Erwägen Sie, eine Trendstärke-Filterung einzusetzen und vermeiden Sie es, in einem schwachen Trend zu handeln.
Zusammenfassen
Die Strategie erfasst die Veränderungen der Markttrends durch die Kreuzprüfung von mehreren technischen Indikatoren und weist eine bessere Zuverlässigkeit und Anpassungsfähigkeit auf. In der praktischen Anwendung ist jedoch auf Probleme wie Signalverzögerung und Überhandelung zu achten. Es wird empfohlen, die Stabilität und Profitabilität der Strategie durch die Einführung von Anpassungsparametern, Stop-Loss-Mechanismen und Marktumfelderkennung zu verbessern.
- 1