Dynamische Trendhandelsstrategie mit zwei Indikatoren: Mehrdimensionales technisches Analysesystem basierend auf RSI und MACD
RSI MACD OB(Overbought) OS(Oversold) TA(Technical Analysis)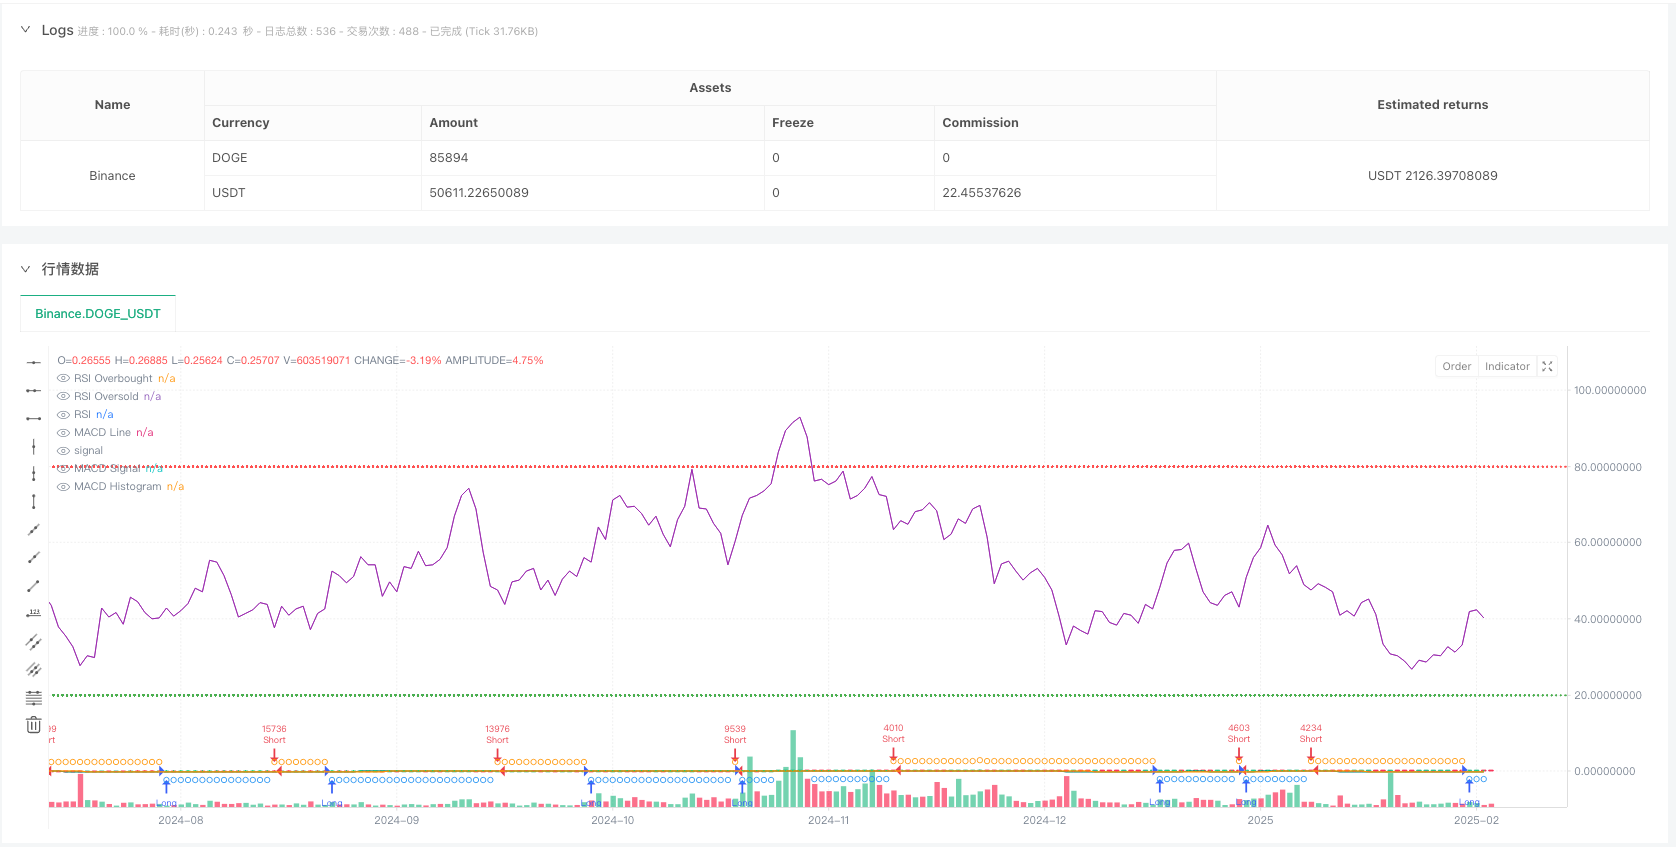
Überblick
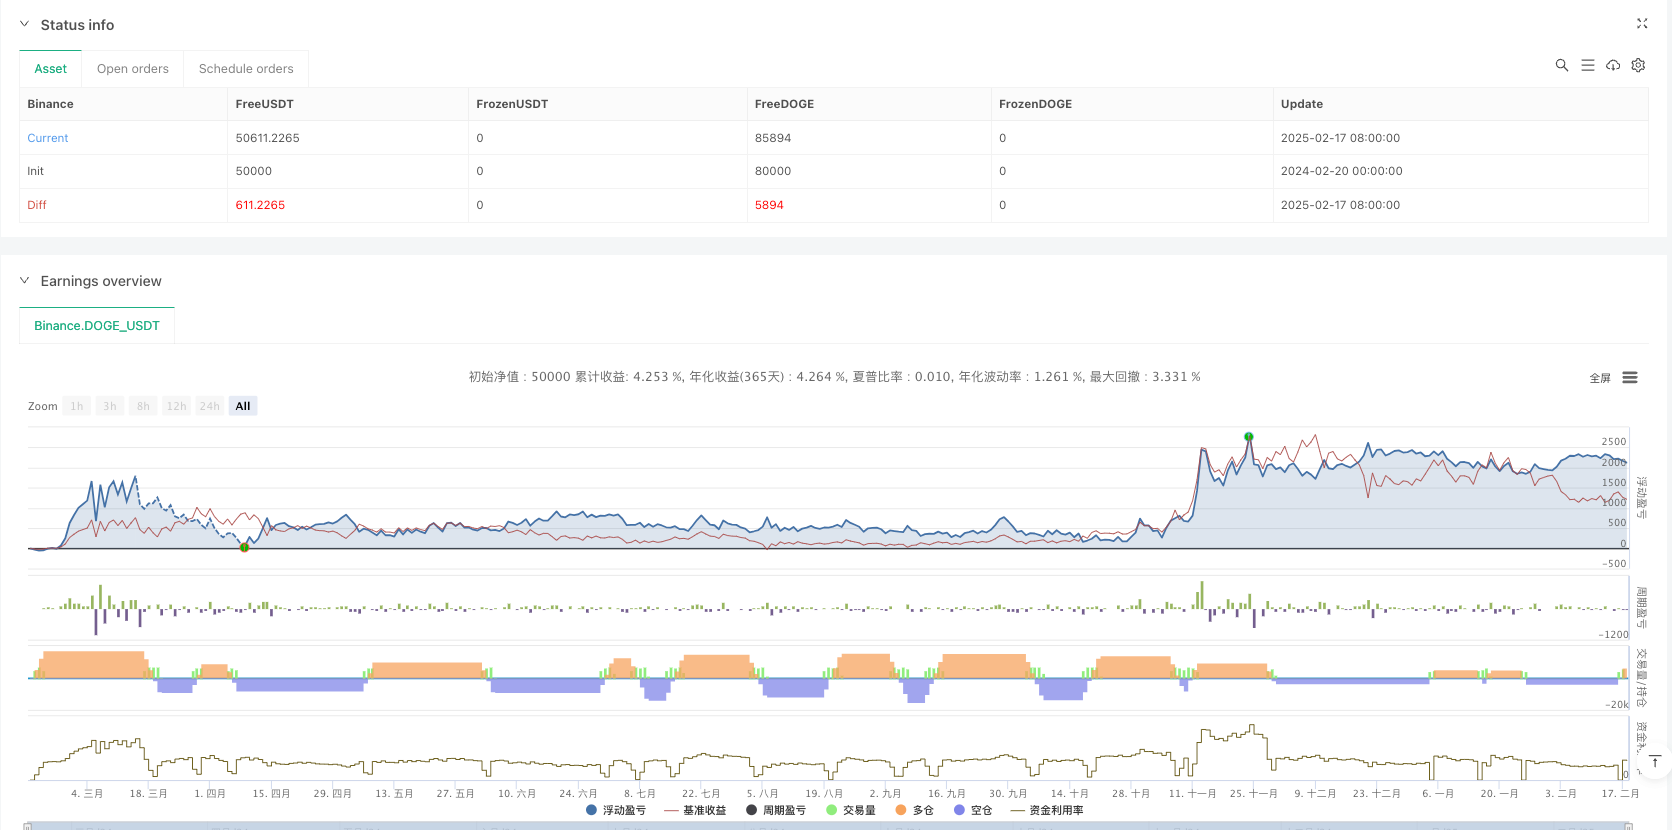
Es handelt sich um eine automatisierte Handelsstrategie, die auf den RSI- und MACD-Dual-Technik-Indikatoren basiert. Die Strategie identifiziert potenzielle Handelschancen und ermöglicht eine präzise Erfassung des Marktes durch die Kombination von Überkauf-Überverkauf-Signalen und Trendbestätigung. Die Strategie verwendet eine prozentuale Positionsverwaltung und verfügt über einen eingebauten Anti-Slip-Point-Mechanismus.
Strategieprinzip
Die Kernlogik der Strategie basiert auf folgenden Schlüsselelementen:
- Überkaufen und überverkaufen mit Hilfe des relativ starken Indikators (RSI) mit einem Parameter von 14 Zyklen, überkaufen 80 und überverkaufen 20
- Trendbestätigung mit MACD ((12,26,9)), Trendänderungen werden über MACD- und Signallinien gekreuzt
- Die Erzeugung eines Handelssignals muss die Bedingungen des RSI und des MACD erfüllen:
- Mehrfache Bedingungen: RSI noch nicht überkauft + MACD-Linie über der Signallinie
- Leerlaufbedingungen: RSI noch nicht überverkauft + MACD-Linie unterhalb der Signallinie
- Die Verwendung von 3% der Kontogewinnschaft als Positionsgröße pro Transaktion und die Begrenzung der Wiederholung von Positionen für gleichzeitige Transaktionen
Strategische Vorteile
- Die kombinierte Verwendung von Dual-Tech-Indicatoren reduziert das Risiko von Falschsignalen erheblich und erhöht die Zuverlässigkeit des Handels.
- Der Prozentsatz-Positions-Management-Ansatz hilft bei der dynamischen Anpassung des Kapitals und einer besseren Risikokontrolle
- Die integrierte Anti-Slip-Punkt-Mechanik (mit 3 Punkten) erhöht die Anpassungsfähigkeit der Strategie in der Festplatte.
- Die Strategie unterstützt die Erschließung von Marktchancen durch mehr Devisenhandel.
- Der Handelsplatz kann individuell angepasst werden, um die verschiedenen Markteigenschaften anzupassen
Strategisches Risiko
- Der RSI und der MACD gehören zu den nachlässigen Indikatoren und können in einem schnelllebigen Markt nicht rechtzeitig reagieren
- Die festgelegte Überkauf-Überverkauf-Schwelle kann unter verschiedenen Marktbedingungen angepasst werden.
- Eine feste Position von 3% kann in einigen Fällen zu groß oder zu klein sein
- Keine Stop-Loss-Beschränkungen, die zu Gewinnrückschlägen oder Verlustvergrößerung führen können
- Die strengen Bedingungen für die Binary Indicators könnten einige potenzielle Handelsmöglichkeiten verpassen.
Richtung der Strategieoptimierung
- Einführung eines adaptiven RSI-Durchschnitts, der überkaufte und überverkaufte Kriterien an die dynamische Marktfluktuation anpasst
- Erhöhung der Stop-Loss-Regelung, empfohlen wird eine dynamische Stop-Loss-Regelung basierend auf ATR oder Volatilität
- Optimierung des Positionsmanagementsystems, wobei die Größe der Positionen dynamisch an die Marktvolatilität und die Veränderung des Nettovermögens der Konten angepasst werden kann
- Hinzufügen von Filtern für die Marktumgebung, Anpassung von Strategieparametern oder Aussetzung von Geschäften unter verschiedenen Marktbedingungen
- Erwägen Sie die Einführung von Umsatzmessungen als Hilfsmittel zur Bestätigung und zur Verbesserung der Signalsicherheit.
Zusammenfassen
Die Strategie hat durch die Synergie von RSI und MACD ein relativ stabiles Handelssystem aufgebaut. Obwohl ein gewisses Rückstandsrisiko besteht, hat die Strategie durch eine vernünftige Risikokontrolle und Parameteroptimierung immer noch einen guten praktischen Wert. Es wird empfohlen, vor der Anwendung in der Praxis ausreichend Rückprüfungen durchzuführen und nach den spezifischen Markteigenschaften gezielt zu optimieren.
//@version=6
strategy("Debugging Demo GPT",
         overlay=true,
         initial_capital=100,
         default_qty_type=strategy.percent_of_equity,
         default_qty_value=3,
         pyramiding=1,
         calc_on_order_fills=true,
         calc_on_every_tick=true,
         slippage=3)

// -----------------------------------------------------------------------
//   (1) Inputs: Start and End Date
// -----------------------------------------------------------------------


// -----------------------------------------------------------------------
//   (2) Indicators (RSI, MACD)
// -----------------------------------------------------------------------

// === RSI ===
rsiLen = input.int(14, "RSI Length")
rsiOB  = input.int(80, "RSI Overbought")
rsiOS  = input.int(20, "RSI Oversold")
rsiVal = ta.rsi(close, rsiLen)

// === MACD ===
fastLen  = input.int(12, "MACD Fast Length")
slowLen  = input.int(26, "MACD Slow Length")
sigLen   = input.int(9,  "MACD Signal Length")
[macdLine, sigLine, histLine] = ta.macd(close, fastLen, slowLen, sigLen)

// -----------------------------------------------------------------------
//   (3) Trading Logic: LONG/SHORT Filters
// -----------------------------------------------------------------------

bool rsiLongOk   = (rsiVal < rsiOB)
bool rsiShortOk  = (rsiVal > rsiOS)
bool macdLongOk  = (macdLine > sigLine)
bool macdShortOk = (macdLine < sigLine)

bool longCondition  = rsiLongOk and macdLongOk
bool shortCondition = rsiShortOk and macdShortOk

// -----------------------------------------------------------------------
//   (4) Entry Conditions
// -----------------------------------------------------------------------

// Debugging: Visualizing the conditions
plotshape(series=longCondition, location=location.belowbar, color=color.blue, style=shape.circle, title="LongCondition", size=size.tiny)
plotshape(series=shortCondition, location=location.abovebar, color=color.orange, style=shape.circle, title="ShortCondition", size=size.tiny)

// Entries only when all conditions are met
if longCondition
    strategy.entry("Long", strategy.long)
if shortCondition
    strategy.entry("Short", strategy.short)

// -----------------------------------------------------------------------
//   (5) Plotting for Visualization
// -----------------------------------------------------------------------

// RSI Plots
hline(rsiOB, "RSI Overbought", color=color.red, linestyle=hline.style_dotted)
hline(rsiOS, "RSI Oversold", color=color.green, linestyle=hline.style_dotted)
plot(rsiVal, title="RSI", color=color.purple)

// MACD Plots
plot(macdLine, color=color.teal, title="MACD Line")
plot(sigLine, color=color.orange, title="MACD Signal")
plot(histLine, style=plot.style_histogram, color=(histLine >= 0 ? color.lime : color.red), title="MACD Histogram")