Dynamische Trendfolgestrategie für mehrere Zeitrahmen, die EMA- und ADX-Indikatoren kombiniert

Überblick
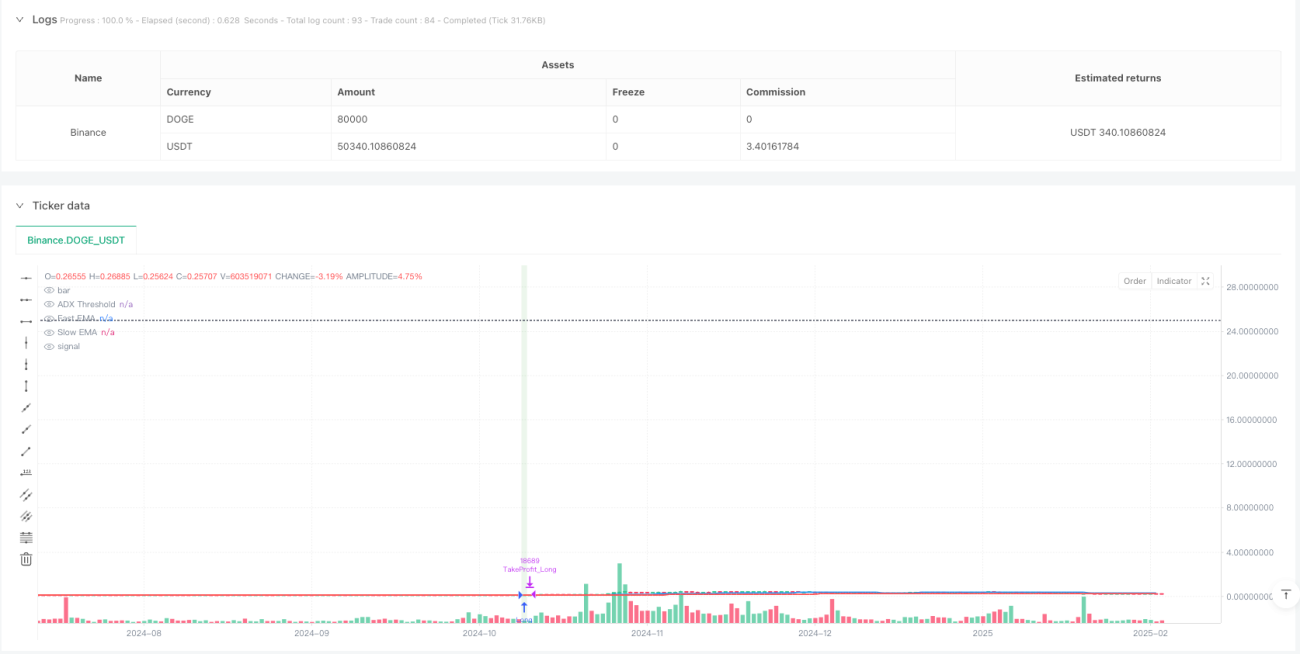
Die Strategie ist ein Trend-Tracking-Trading-System, das die Analyse von mehreren Zeiträumen kombiniert und mehrere technische Indikatoren wie den Index Moving Average (EMA), den Average Trend Index (ADX) und den Relative Strength Index (RSI) integriert, um in einem 15-Minuten-Zeitrahmen zu handeln. Die Strategie verwendet eine konservative Positionsmanagement-Methode, bei der das Risiko pro Handel auf 2% des gesamten Kontos begrenzt wird, um langfristig stabile Erträge zu erzielen.
Strategieprinzip
Die Strategie verwendet eine Kreuzung von schnellen EMAs ((50-Zyklen) und langsamen EMAs ((200-Zyklen)), um die Richtung des Trends zu identifizieren, und in Kombination mit dem ADX-Indikator, um die Trendstärke zu bestätigen. Wenn der ADX-Wert größer als 25 ist, zeigt der Markt einen starken Trend. Der RSI-Indikator wird verwendet, um einen Überkauf-Überverkauf zu identifizieren.
Strategische Vorteile
- Die Integration mehrerer technischer Kennzahlen reduziert die Auswirkungen von Falschsignalen und erhöht die Zuverlässigkeit des Handels.
- Die Einstellung der Stop-Loss-Einstellungen ist dynamisch und lässt sich flexibel an Marktbewegungen anpassen.
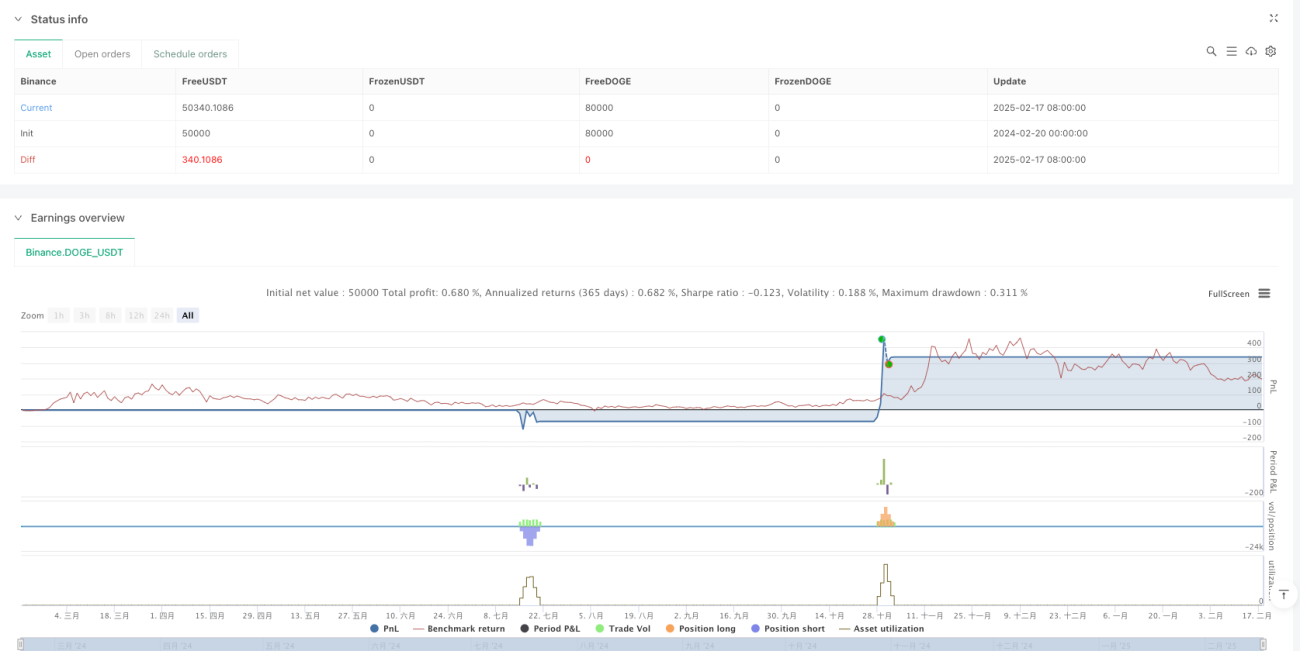
- Die konservative Positionsmanagement-Strategie (Risiko-Kontrolle von 2%) reduziert das Rücknahme-Risiko.
- Die Analyse von mehreren Zeitrahmen bietet einen umfassenderen Blick auf Markttrends.
- Die Strategie Rückmessung zeigt eine Gewinnrate von 62.86% und einen Gewinnfaktor von 1.136.
Strategisches Risiko
- In einem wackligen Markt kann es zu häufigen Handelssignalen kommen, die die Kosten erhöhen.
- Die EMA-Kreuzstrategie kann bei einer schnellen Umkehrung verzögert reagieren.
- Eine übermäßige Abhängigkeit von technischen Indikatoren kann die Auswirkungen grundlegender Faktoren übersehen.
- Festgelegte ADX-Thresholds können in unterschiedlichen Marktumgebungen unterschiedlich wirken.
Richtung der Strategieoptimierung
- Einführung von Volatilitätsindikatoren (z. B. ATR) zur dynamischen Anpassung des Stop-Loss-Niveaus.
- Erwägen Sie die Einbeziehung eines Transaktionsvolumens als zusätzliche Bestätigung für ein Handelssignal.
- Entwicklung eines adaptiven ADX-Threshold-Systems für unterschiedliche Marktbedingungen.
- Die Zugabe von Market Sentiment Indicators zur Verbesserung der Genauigkeit der Einstiegsmomente.
- Optimieren Sie die Zykluswahl für mehrere Zeiträume und suchen Sie nach der optimalen Kombination.
Zusammenfassen
Die Strategie weist durch ihre multidimensionalen Methoden der technischen Analyse und strenge Risikokontrollen ein gutes Handelspotenzial auf. Obwohl sie in der Rückmessung stabil ist, muss sie in der realen Umgebung vollständig verifiziert werden. Die modulare Gestaltung der Strategie bietet eine starke Anpassungsfähigkeit und Optimierungsmöglichkeiten, die flexibel an Marktveränderungen angepasst werden können.
- 1