
Überblick
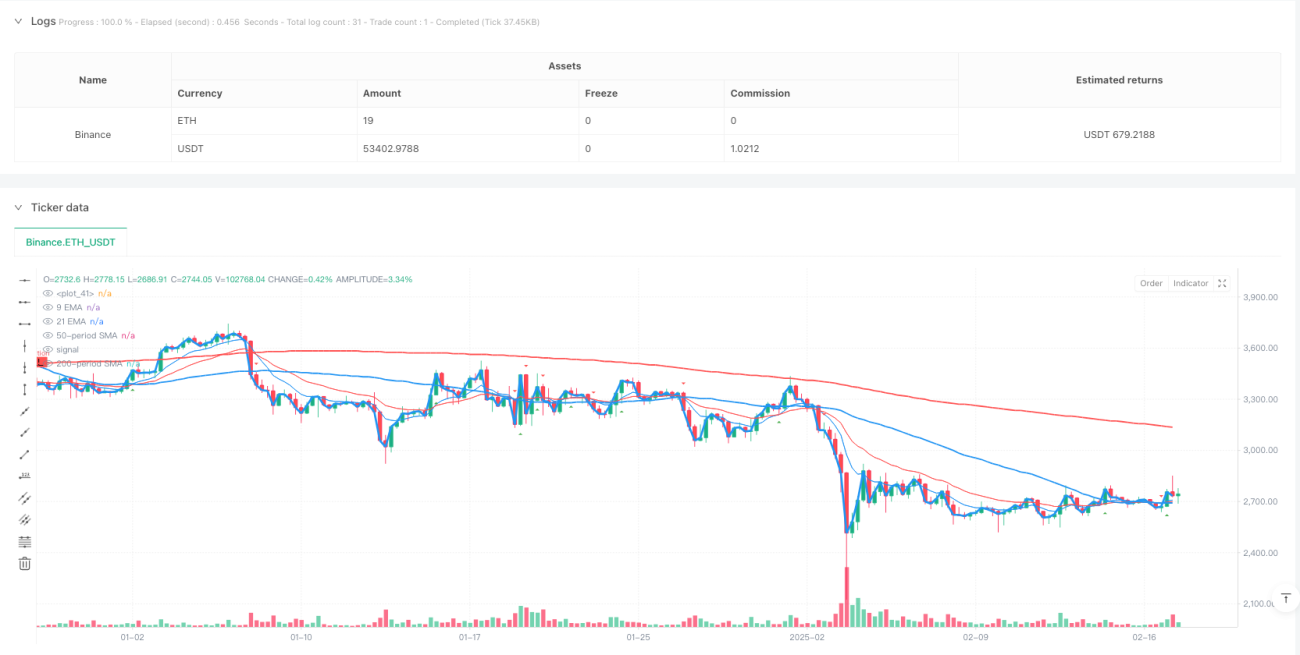
Die Strategie basiert auf einer Kombination aus mehreren Durchschnittslinien, kombiniert mit einem 9-Zyklus-, 21-Zyklus-, 50-Zyklus- und 200-Zyklus-Moving-Average, um die Wendepunkte der Markttrends zu erfassen. Die Strategie kombiniert die Vorteile der kurz- und langfristigen Durchschnittslinien, um sowohl Änderungen der Marktdynamik als auch die Möglichkeit, falsche Signale effektiv zu filtern, zu erfassen.
Strategieprinzip
Die Kernlogik der Strategie basiert auf einem linearen Kreuzungssystem mit mehreren Zeitrahmen.
- Ein einfacher Moving Average (SMA) mit 50 und 200 Zyklen als Haupttrendindikator
- Verwendung eines Index-Moving Averages (EMA) mit 9 und 21 Perioden als kurzfristige Signalbestätigung
- Optimierung der Signalqualität durch Einstellung von Lookback- und Threshold-Parametern
- Identifizierung wichtiger Preisniveaus durch Datenperspektiven-Algorithmen in Kombination mit der Beurteilung wichtiger Preisstützungen und -Widerstände
Wenn die kurzfristige Durchschnittslinie die langfristige Durchschnittslinie nach oben durchquert, gibt das System ein Mehrsignal ab; umgekehrt gibt es ein Leersignal.
Strategische Vorteile
- Zuverlässigkeit des Signalsystems: Durch die Kreuzbestätigung mit mehreren Mittellinien wird das Risiko für falsche Signale deutlich reduziert
- Aktualität bei der Erfassung von Trends: Die Einführung von kurzfristigen Mittellinien ermöglicht eine schnelle Reaktion auf Marktveränderungen
- Ganzheitlichkeit der Risikokontrolle: Die Identifizierung von Unterstützungs- und Widerstandspunkten hilft bei der vernünftigen Einstellung der Stop-Loss-Stop-Position
- Flexibilität bei der Optimierung von Parametern: Rücklaufzeiten und Wertminderungsparameter können an unterschiedliche Marktbedingungen angepasst werden
- Intuitivität der visuellen Effekte: Das System bietet eine klare grafische Oberfläche, um die Handelsentscheidungen zu erleichtern
Strategisches Risiko
- Risiken von Marktschocks: Häufige Falschsignale während der Quer-Strecken-Phase
- Rückstandsrisiko: Der Moving Average ist im Wesentlichen ein Rückstandsindikator, der möglicherweise die beste Einstiegsmomente verpasst
- Parametersensitivität: Unterschiedliche Parameterkombinationen können zu großen Unterschieden in der Strategieleistung führen
- Marktumgebungsabhängigkeit: Strategien, die in trendigen Märkten besser abschneiden als in Zeiten starker Schwankungen
Richtung der Strategieoptimierung
- Einführung von Energiemesswerten: Erwägen Sie die Verwendung von Transaktionsmengen als Hilfsindikator für die Signalbestätigung
- Optimierte Signalfilterung: Stärkere Signalbestätigungsmechanismen entwickeln, die eine bestimmte Dauer erfordern
- Dynamische Parameteranpassung: Entwicklung eines adaptiven Parametersystems, das automatisch Parameter an die Marktlage anpasst
- Verbesserung der Risikokontrollen: Erhöhung der dynamischen Stop-Loss-Mechanismen und Schutz der bereits erzielten Gewinne
- Marktumfeldbeurteilung: Kombination von Volatilitätsindikatoren mit unterschiedlichen Parameter-Sets für unterschiedliche Marktumgebungen
Zusammenfassen
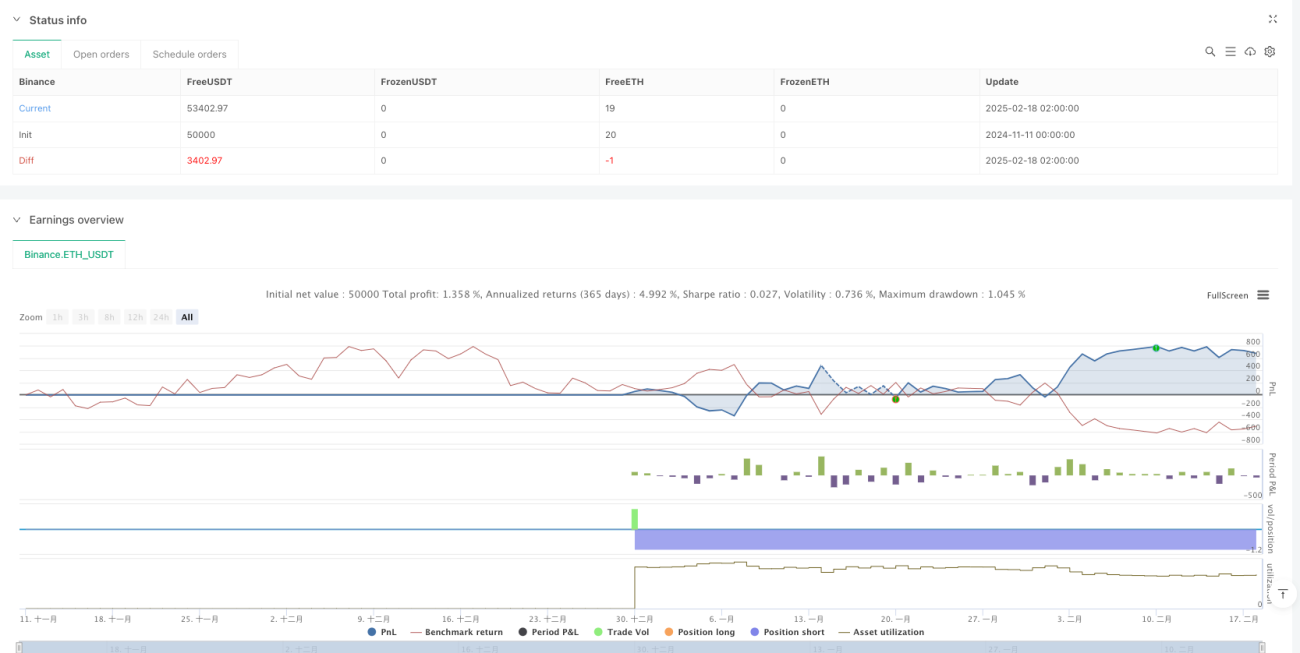
Die Strategie ermöglicht die effektive Identifizierung von Wendepunkten bei Markttrends durch die Synergie von mehreren Gleichgewichtssystemen. Die Strategie wurde konzentriert auf die Praktikabilität und Handhabbarkeit und kann durch die flexible Anpassung der Parameter an verschiedene Marktumgebungen angepasst werden. Obwohl es einige Einschränkungen gibt, hat die Strategie durch kontinuierliche Optimierung und Verbesserung ein gutes Entwicklungspotenzial.
- 1