Mehrperioden-Trendverfolgungs- und Volumenbestätigungsstrategie

Überblick
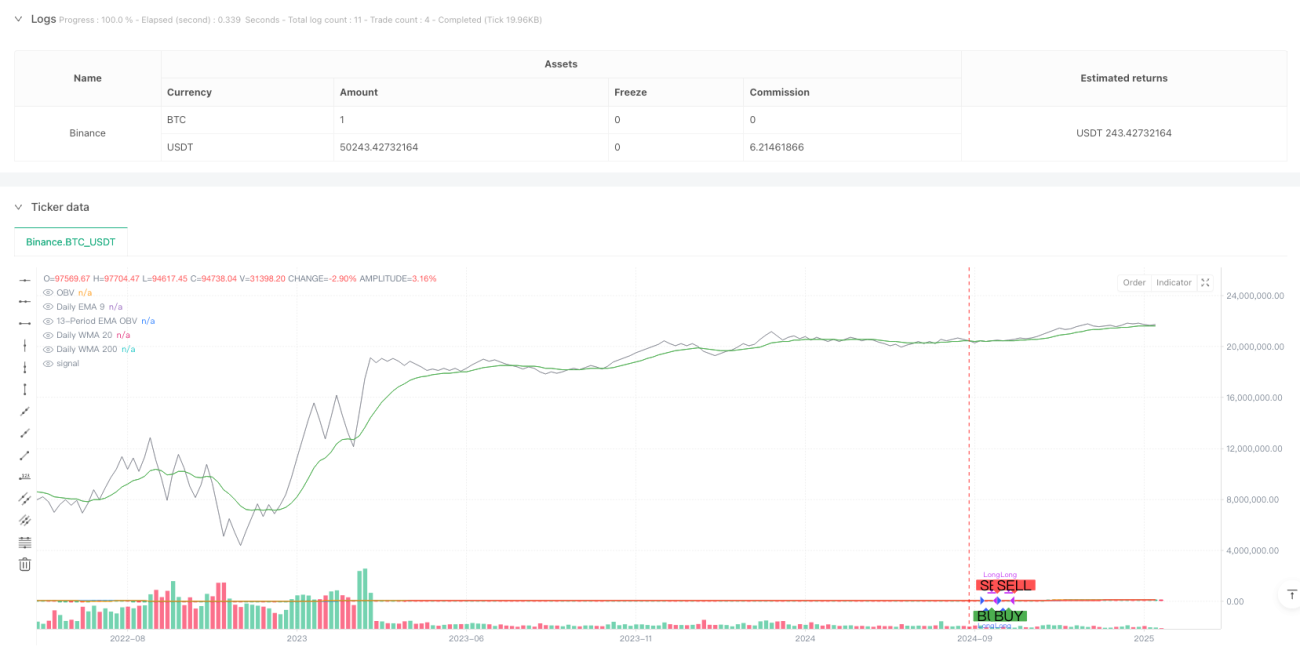
Die Strategie ist ein Trend-Tracking-System, das mehrperiodische Moving Averages und Transaktionsvolumen-Analysen kombiniert. Die Strategie bestätigt den Gesamttrend durch die drei mittleren Linien EMA9, WMA20 und WMA200 für die Tageszeiten und führt gleichzeitig die OBV (On Balance Volume) -Anzeige und ihre EMA zur Transaktionsvolumenbestätigung ein, um einen stabileren Trend-Tracking-Geschäft zu ermöglichen.
Strategieprinzip
Die Strategie basiert auf zwei zentralen Bedingungen:
- Trendbestätigung - Die Trendrichtung wird bestätigt, indem beurteilt wird, ob die drei Tagesmittellinien (EMA9, WMA20 und WMA200) im Aufwärtstrend sind. Wenn alle drei Mittellinien nach oben neigen, zeigt dies, dass die Zeiträume einen mehrköpfigen Trend aufweisen.
- Umsatzbestätigung - Umsatzanalyse mit dem OBV-Indikator und seiner 13-Zyklus-EMA. Wenn das EMA des OBV über dem OBV liegt, zeigt dies, dass der Umsatz einen Preisanstieg unterstützt und die Effektivität des Trends bestätigt.
Die Strategie erzeugt nur dann mehrere Signale, wenn beide Bedingungen gleichzeitig erfüllt sind. Wenn eine der beiden Bedingungen nicht erfüllt ist, wird die Strategie aus dem Spiel gezogen.
Strategische Vorteile
- Mehrfache Zeitrahmenanalyse - Verringerung des False-Breakout-Risikos durch die integrierte Berücksichtigung von kurzfristigen (EMA9), mittleren (WMA20) und langfristigen (WMA200) Trends.
- Umsatzstützung - Einführung der OBV-Analyse, um sicherzustellen, dass die Preisentwicklung durch die Umsatzstützung unterstützt wird.
- Gute Risikokontrolle - Prozentsatz der Positionsverwaltung und der Gebühren berücksichtigt, die dem tatsächlichen Handelsumfeld entsprechen.
- Visuelle Unterstützung - Hilft Händlern, die Ein- und Ausstiegszeiten zu verstehen, durch klare grafische Markierungen.
Strategisches Risiko
- Trendwendeverzögerung - Aufgrund der Verwendung von mehreren Mittellinien kann es zu einer langsamen Reaktion bei einer Trendwende kommen.
- Nicht für Schaukelmärkte - häufige falsche Durchbrüche können zu hohen Transaktionen führen.
- Die Kosten für die Finanzierung sind zu berücksichtigen - eine Gebühr von 0,1% kann bei Hochfrequenz-Handelsgeschäften einen erheblichen Einfluss auf die Erträge haben.
Richtung der Strategieoptimierung
- Einführung von Volatilitätsindikatoren - Es kann in Betracht gezogen werden, Volatilitätsindikatoren wie ATR hinzuzufügen, um Positionen dynamisch in verschiedenen Marktumgebungen anzupassen.
- Verbesserte Stop-Loss-Mechanismen - Empfehlung, die Stop-Loss-Funktion zu erweitern, um die Gewinne besser zu schützen.
- Marktumfeld-Filter - Hinzufügen von Marktumfeld-Beschätzungsindikatoren, um die Handelsfrequenz zu verringern oder den Handel in einem wackligen Markt auszusetzen.
- Optimierung der Parameter - Optimierung der Durchschnittszyklus- und OBV-Parameter für verschiedene Märkte und Sorten in Betracht gezogen.
Zusammenfassen
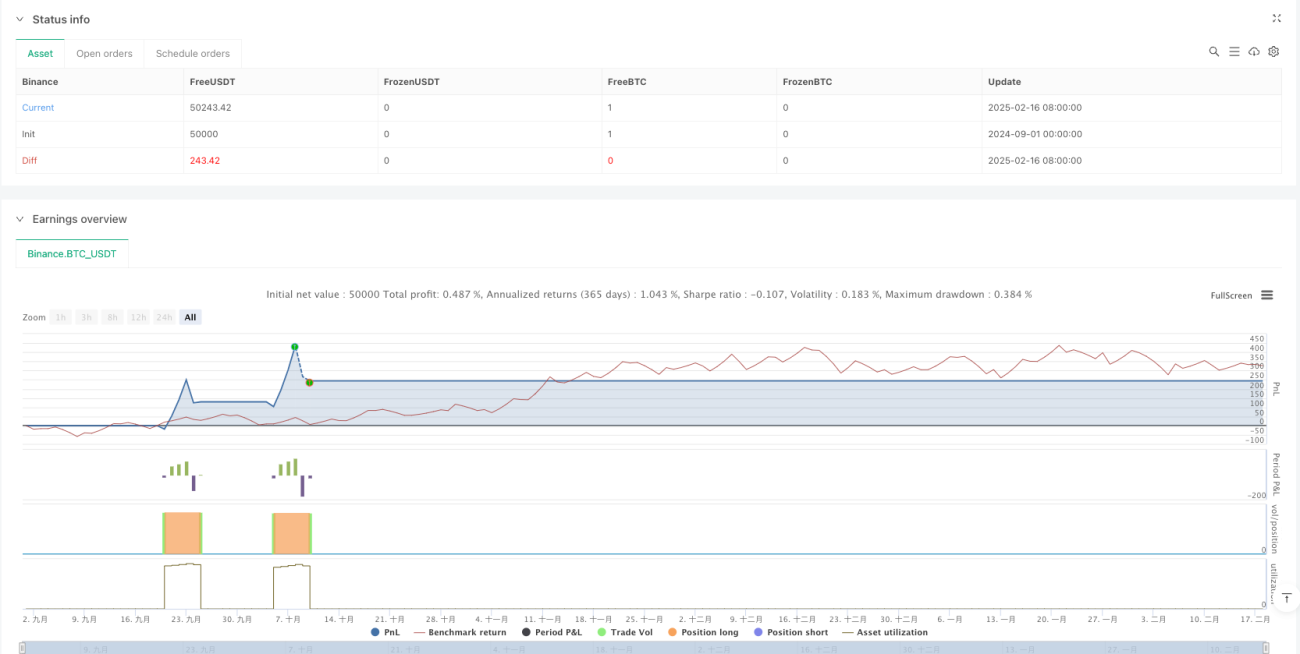
Die Strategie kombiniert mehrperiodische Trendanalysen mit der Bestätigung von Transaktionsmengen und baut ein relativ vollständiges Trend-Tracking-System auf. Die Strategie-Logik ist klar, die Risikokontrolle ist vernünftig, aber es gibt noch Optimierungsmöglichkeiten. Es wird empfohlen, dass Händler sorgfältig in der realen Welt testen und die Parameter an die spezifischen Markteigenschaften anpassen.
/*backtest
start: 2024-09-01 00:00:00
end: 2025-02-18 08:00:00
period: 5d
basePeriod: 5d
exchanges: [{"eid":"Binance","currency":"BTC_USDT"}]
*/

//@version=6
strategy("Strategy: Daily MAs + OBV", overlay=true, initial_capital=10000, default_qty_type=strategy.percent_of_equity, default_qty_value=10, commission_type=strategy.commission.percent, commission_value=0.1)

//=== Daily Moving Averages Calculation =========================- 1