Effiziente quantitative Handelsstrategien basierend auf Preisspannen und Durchbrüchen
Pivot CONSOLIDATION ZONE BREAKOUT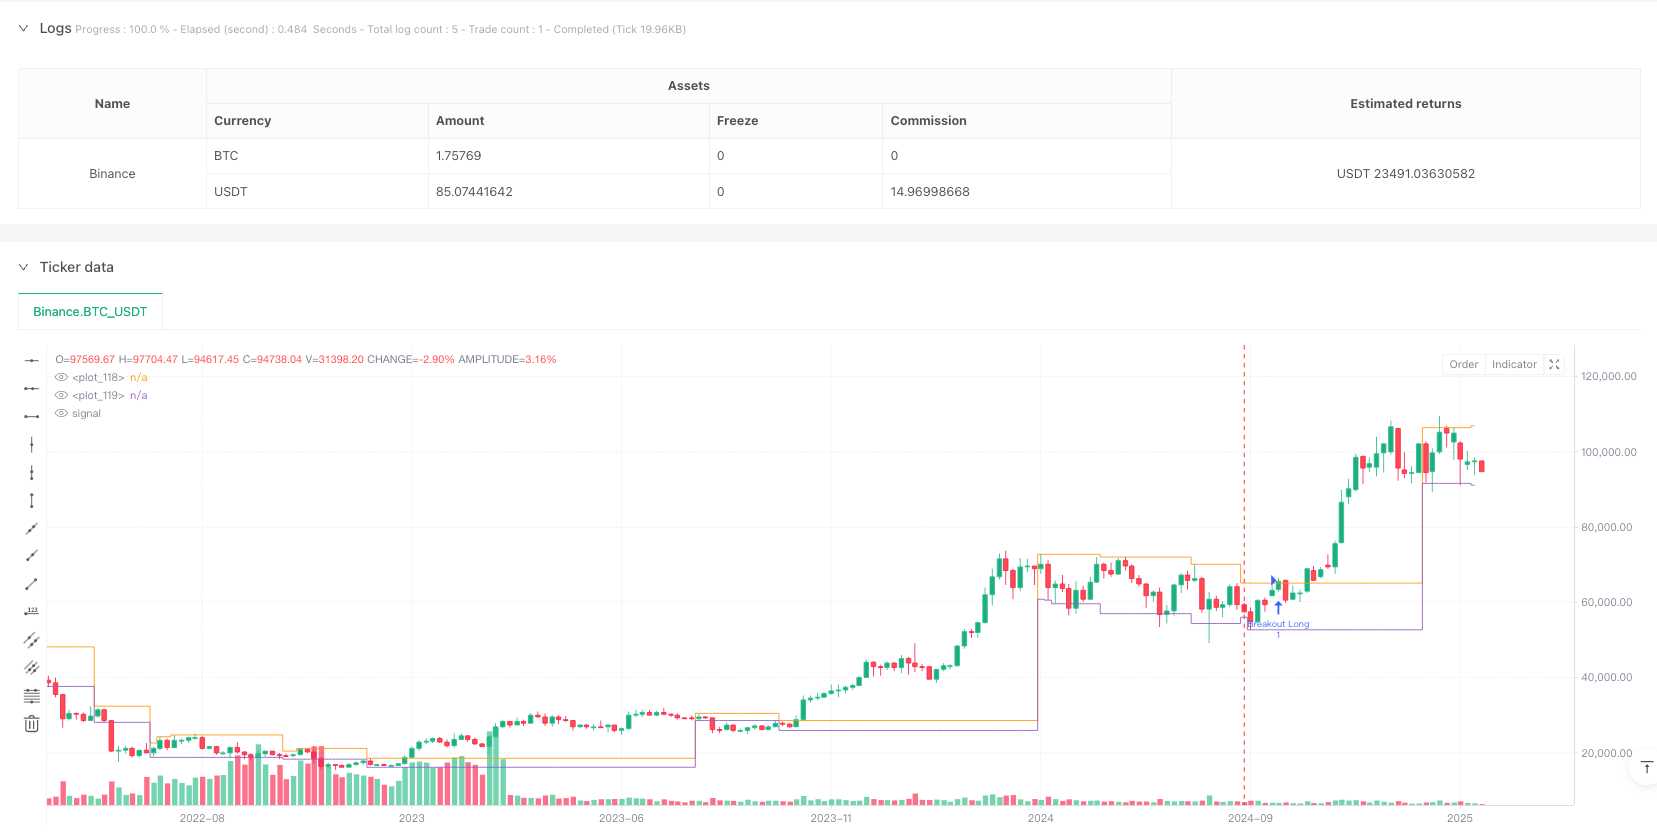
Überblick
Es handelt sich um eine effiziente, quantitative Handelsstrategie, die auf Preisspannen und -brechungen basiert. Die Strategie wird hauptsächlich durch die Identifizierung von Bilanzierungsbereichen im Markt ausgeführt und handelt, wenn die Preise diese Bilanzierungsbereiche überschreiten. Die Strategie verwendet den ZigZag-Indikator, um die kritischen Preispunkte zu identifizieren, die Bilanzierungsbereiche in Kombination mit den Höhen und Tiefen definieren, und signalisiert den Handel, wenn die Preise diese Bereiche überschreiten.
Strategieprinzip
Die Kernlogik der Strategie besteht aus folgenden Schlüsselschritten:
- Wichtige Wendepunkte werden durch Höchst- und Tiefstpreise innerhalb des Loopback-Periodes identifiziert
- Tracking von Kursbewegungen mit ZigZag-Algorithmen, um wichtige Unterstützungs- und Widerstandspunkte zu identifizieren
- Bestätigen Sie den effektiven Konsolidierungsbereich, indem Sie die minimale Konsolidierungslänge festlegen
- Dynamische Updates der oberen und unteren Grenzen, die Veränderungen in der Ausgleichszone in Echtzeit verfolgen
- Trigger eines Handelssignals, wenn der Preis eine Brechung durch die Umrechnungszone durchläuft
Strategische Vorteile
- Anpassungsfähigkeit - Strategien können dynamische Berechnungsbereiche identifizieren und aktualisieren, um sich an unterschiedliche Marktbedingungen anzupassen
- Risikokontrolliert - eine klare Stop-Loss-Position für den Handel durch eine eindeutige Definition der Bereinigungsspanne
- Visuelle Unterstützung - visuelle Darstellung der Berechnungszonen, um den Händlern die Marktlage zu verstehen
- Zwei-Wege-Handel - Unterstützung von Auf- und Abbruchgeschäften zur Maximierung von Marktchancen
- Anpassbarkeit der Parameter - Bereitstellung mehrerer anpassbarer Parameter zur Optimierung für unterschiedliche Markteigenschaften
Strategisches Risiko
- Gefahr von False Breakouts - False Breakouts, die zum Scheitern führen können
- Gleitrisiko - bei schnellen Fahrten können größere Gleitpunkte auftreten
- Marktumgebungsabhängigkeit - Strategie, die in einem turbulenten Markt gut abschneidet, aber in einem Trendmarkt schlechter abschneidet
- Parameter-Sensitivität - falsche Parameter-Einstellungen können die Leistung der Strategie beeinträchtigen
- Risikomanagement - die Größe des Geldes, das bei jedem Handel verwendet wird, muss angemessen kontrolliert werden
Richtung der Strategieoptimierung
- Einführung von Transaktionsindikatoren - die Wirksamkeit von Durchbrüchen wird durch Transaktionsmengen bestätigt
- Optimierung der Zulassungszeit - Erhöhung der Rückrufbestätigungsmechanismen und Verbesserung der Zulassungsqualität
- Verbesserung der Stop-Loss-Mechanismen - Gestaltung flexiblerer Stop-Loss-Strategien
- Erhöhung der Filterung der Marktumgebung - Hinzufügen von Trendbeurteilungen, die unter geeigneten Marktumgebungen funktionieren
- Optimierungsparameter sind anpassungsfähig - automatische Anpassung der Parameter an die Marktvolatilität
Zusammenfassen
Es ist eine quantitative Handelsstrategie, die vernünftig und logisch konzipiert ist. Sie bietet Händlern ein zuverlässiges Handelssystem, indem sie die Identifizierung und Erfassung von Durchbruchsignalen für die Bilanzbereiche ermöglicht. Die Visualisierungseffekte und die Flexibilität der Parameter der Strategie machen sie praktisch nutzbar. Durch kontinuierliche Optimierung und Risikokontrolle wird die Strategie zu einem stabilen Ertrag im tatsächlichen Handel führen.
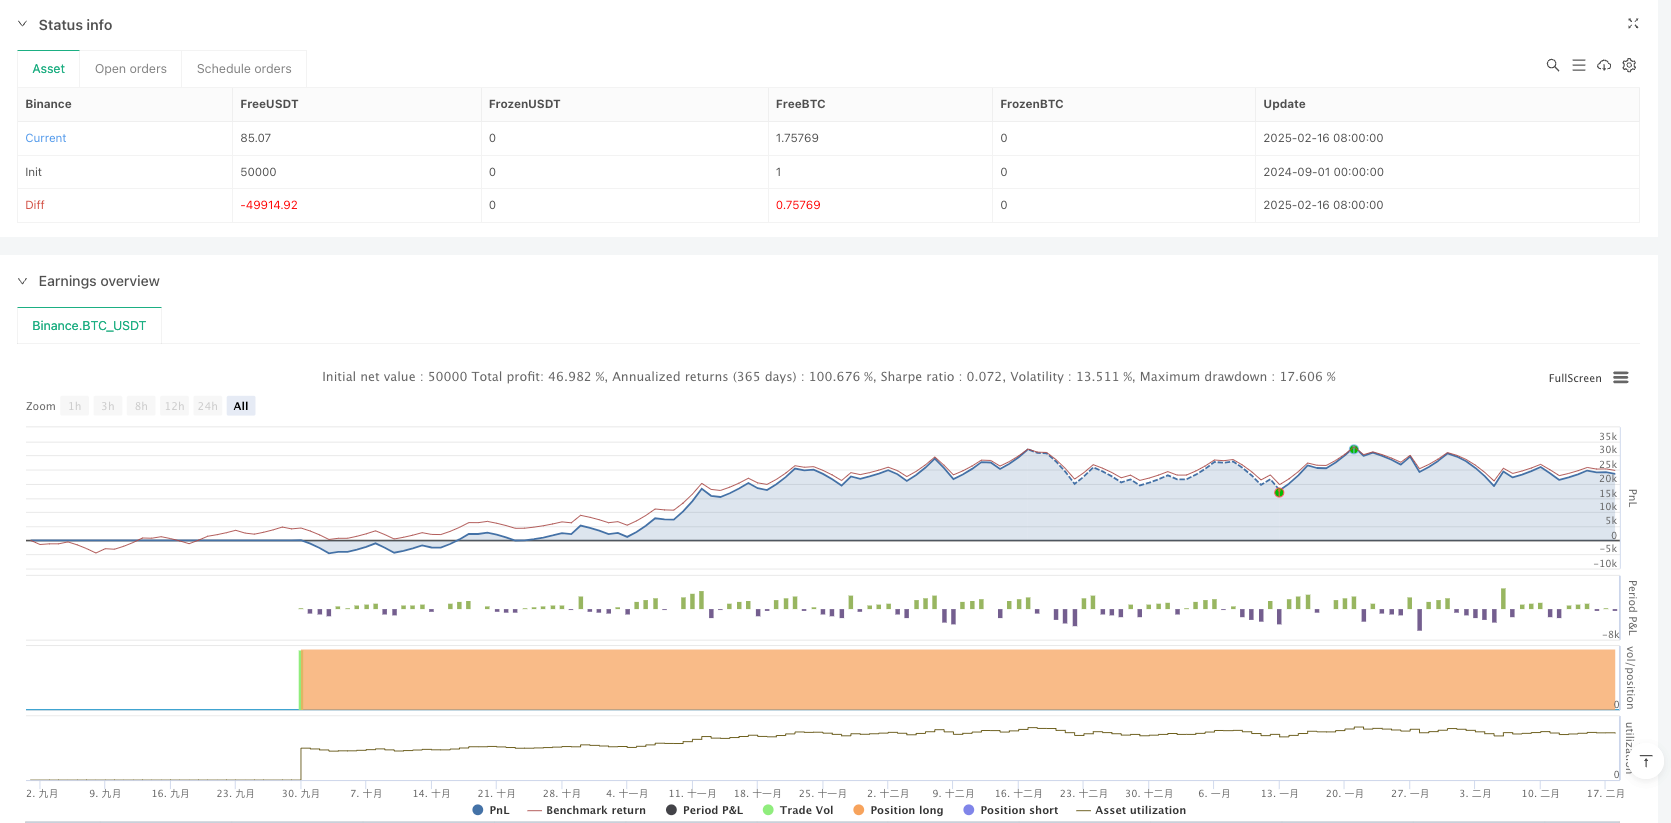
/*backtest
start: 2024-09-01 00:00:00
end: 2025-02-18 08:00:00
period: 5d
basePeriod: 5d
exchanges: [{"eid":"Binance","currency":"BTC_USDT"}]
*/

// This code is released under the Mozilla Public License 2.0
// More details at: https://mozilla.org/MPL/2.0/
// © LonesomeTheBlue

//@version=5
strategy("Consolidation Zones - Live [Strategy]", overlay=true, max_bars_back=1100)

//-----------------------------------------------------------------------//
//                        Input Variables
//-----------------------------------------------------------------------//
prd       = input.int(defval=10, title="Loopback Period", minval=2, maxval=50)
conslen   = input.int(defval=5,  title="Min. Consolidation Length", minval=2, maxval=20)
paintcons = input.bool(defval=true, title="Color Consolidation Zone?")
zonecol   = input.color(defval=color.new(color.blue, 70), title="Zone Color")

//-----------------------------------------------------------------------//
//                  Variables and Calculations for ZZ (ZigZag) Detection
//-----------------------------------------------------------------------//

// Check if the bar has the highest High or lowest Low in the last prd bars
float hb_ = ta.highestbars(prd) == 0 ? high : na
float lb_ = ta.lowestbars(prd)  == 0 ? low  : na

// Convert to bool to check if hb_ and lb_ are valid (not na)
bool hasHb = not na(hb_)
bool hasLb = not na(lb_)

// Direction variable to determine the trend, based on the last high or low pivot
var int dir = 0

// ZigZag value and last pivot
float zz = na
float pp = na

// 1) Determine direction based on whether a high or low pivot occurred
dir := if hasHb and not hasLb
    1
else if hasLb and not hasHb
    -1
else
    dir  // unchanged direction

// 2) If both a high and low pivot occurred in the same bar
bool sameBar = hasHb and hasLb
if sameBar
    if dir == 1
        zz := hb_
    else
        zz := lb_
else
    zz := hasHb ? hb_ : (hasLb ? lb_ : na)

// 3) Storing last pivots (pp) - iterate over older bars
for x = 0 to 1000
    if na(close) or dir != dir[x]
        break
    if not na(zz[x])  // if zz[x] is a valid value
        if na(pp)
            pp := zz[x]
        else
            if dir[x] == 1 and zz[x] > pp
                pp := zz[x]
            if dir[x] == -1 and zz[x] < pp
                pp := zz[x]

//-----------------------------------------------------------------------//
//                Logic for Consolidation Zone Detection
//-----------------------------------------------------------------------//
var int   conscnt    = 0
var float condhigh   = na
var float condlow    = na

float H_ = ta.highest(conslen)
float L_ = ta.lowest(conslen)

var line upline      = na
var line dnline      = na

bool breakoutup    = false
bool breakoutdown  = false

// Check if pp has changed
bool changedPP = ta.change(pp) != 0

if changedPP
    // If enough candles are in consolidation, check for breakout
    if conscnt > conslen and not na(condhigh) and not na(condlow) and not na(pp)
        if pp > condhigh
            breakoutup := true
        if pp < condlow
            breakoutdown := true

    // Check if we are still "in the zone"
    bool inZone = conscnt > 0 and not na(pp) and not na(condhigh) and not na(condlow) and (pp <= condhigh) and (pp >= condlow)
    if inZone
        conscnt += 1
    else
        conscnt := 0
else
    // No change in pivot -> continue consolidation
    conscnt += 1

if conscnt >= conslen
    // At the first "touch" of the required number of candles
    if conscnt == conslen
        condhigh := H_
        condlow  := L_
    else
        condhigh := math.max(condhigh, high)
        condlow  := math.min(condlow, low)


//-----------------------------------------------------------------------//
//                          Drawing Fill
//-----------------------------------------------------------------------//
// Declare two plot variables (just ordinary assignment)
condHighPlot = plot(condhigh, color=na, style=plot.style_stepline)
condLowPlot  = plot(condlow,  color=na, style=plot.style_stepline)

// bool to check if we want to color the zone
bool doFill = paintcons and (conscnt > conslen)

// Calling fill
fill(condHighPlot, condLowPlot, color= doFill ? zonecol : color.new(color.white, 100))

//-----------------------------------------------------------------------//
//                          Alerts & STRATEGY
//-----------------------------------------------------------------------//
alertcondition(breakoutup,   title="Breakout Up",   message="Breakout Up")
alertcondition(breakoutdown, title="Breakout Down", message="Breakout Down")

if breakoutup
    // Close short first
    if strategy.position_size < 0
        strategy.close("Breakout Short")
    // Open LONG
    strategy.entry("Breakout Long", strategy.long)

if breakoutdown
    // Close long first
    if strategy.position_size > 0
        strategy.close("Breakout Long")
    // Open SHORT
    strategy.entry("Breakout Short", strategy.short)