Momentum Trend SuperTrend und Stochastic Crossover-Strategie

Überblick
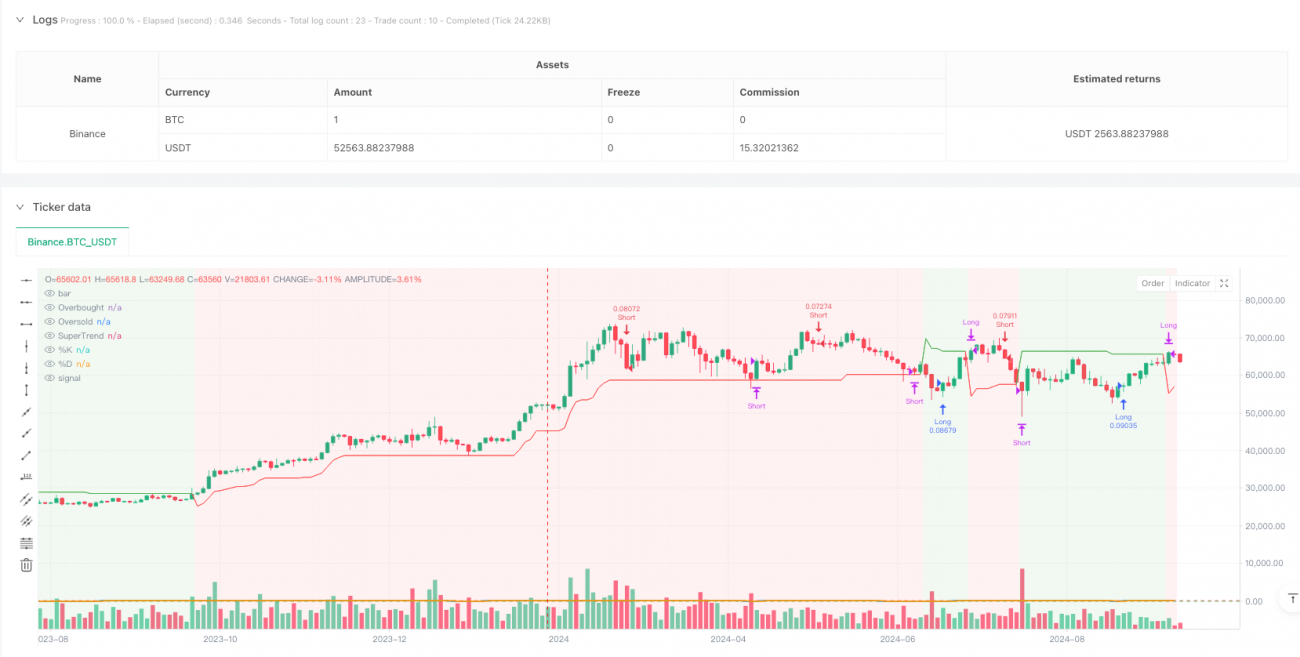
Die Strategie ist ein Trend-Tracking-Trading-System, das die SuperTrend-Indikatoren und den Stochastic Oscillator kombiniert. Die Strategie identifiziert die Richtung der Markttrend durch die SuperTrend-Indikatoren und nutzt die Überkauf-Überverkauf-Signale der Zufallsindikatoren als Bestätigungssignale für den Handel. Die Strategie verwendet die Dynamik-Cross-Methode, um die besten Einstiegs- und Ausstiegsmomente in der Trendrichtung zu finden, um die perfekte Kombination von Trend-Tracking und Dynamik-Analyse zu erreichen.
Strategieprinzip
Die Kernlogik der Strategie basiert auf der Kombination zweier Hauptindikatoren:
- SuperTrend-Indikator: Berechnet auf Basis des ATR (Average True Rate) zur Ermittlung von Markttrends. Wenn die Indikatorlinie von Rot auf Grün geht, zeigt sie einen Aufwärtstrend an, wenn sie von Grün auf Rot geht, zeigt sie einen Abwärtstrend an.
- Zufällige Indikatoren: zur Identifizierung von Überkauf-Überverkauf-Zuständen in einem Markt. Die Parameter-Einstellung für% K-Zyklus ist 14,% D-Zyklus ist 3, Überkauf-Level 80 und Überverkauf-Level 20
Die Regeln für den Handel lauten:
- Mehrere Bedingungen: SuperTrend zeigt einen Aufwärtstrend (grün), und der zufällige Indikator% K-Linie von unten nach oben über den Überverkauf (20)
- Leerlaufbedingungen: SuperTrend zeigt einen Abwärtstrend (rot), und der zufällige Indikator% K-Linie durchquert den Überkauf von oben nach unten (80).
- Binäre Bedingungen: SuperTrend wird zu einem Abwärtstrend, oder der Zufallsindikator% K-Linie geht nach unten und überschreitet die Überkaufstufe
- Flachraum: SuperTrend wird zu einem Aufwärtstrend, oder der zufällige Indikator% K-Linie überschreitet den Überverkauf
Strategische Vorteile
- Trendbestätigung: Identifizieren Sie die wichtigsten Markttrends mithilfe der SuperTrend-Indikatoren und verringern Sie die Gefahr von Falschbrüchen
- Dynamik-Verifizierung: Dynamiksignale in Kombination mit Zufallsindikatoren, um die Genauigkeit und Aktualität der Transaktionen zu verbessern
- Risikokontrolle: Überkauf-Überverkauf-Level als Stop-Loss-Referenz zur Bereitstellung eines klaren Risikomanagement-Frameworks
- Visualisierung: Die Strategie bietet eine intuitive grafische Oberfläche, einschließlich Trend-Hintergrundfarben und Veränderungen der Indikatorlinien, um den Händlern zu helfen, die Marktlage zu verstehen
- Flexibilität der Parameter: Alle wichtigen Parameter können an unterschiedliche Markteigenschaften angepasst werden
Strategisches Risiko
- Marktrampenrisiken: Häufige Falschsignale können zu Überhändlungen führen
- Rückstandsrisiko: Supertrends und Zufallsindikatoren haben einen Rückstand und können die besten Einstiegsmomente verpassen
- Parameter-Sensitivität: Unterschiedliche Parameter-Einstellungen können zu signifikant unterschiedlichen Transaktionsergebnissen führen und müssen umfassend getestet werden
- Marktumfeldabhängigkeit: Strategie, die in stark trendigen Märkten gut abschneidet, aber in stark schwankenden Märkten schlechter abschneidet
- Signalkonflikte: Zwei Indikatoren können widersprüchliche Signale erzeugen und müssen klar priorisiert werden.
Richtung der Strategieoptimierung
- Einführung eines Volatilitätsfilters: ATR-Durchschnittsurteil hinzugefügt, um den Handel bei zu hoher Volatilität auszusetzen
- Optimierung der Signalbestätigung: Zusätzliche Indikatoren wie beispielsweise die Moving Average können in Betracht gezogen werden, um die Signalsicherheit zu verbessern
- Verbesserte Stop-Loss-Mechanismen: Empfehlung zur Hinzufügung von Stop-Loss-Tracking-Funktionen, um bereits erzielte Gewinne besser zu schützen
- Erweiterte Zeitfilterung: Strategieparameter können anhand von Markteigenschaften für verschiedene Zeiträume angepasst werden oder der Handel kann ausgesetzt werden
- Entwicklung von Anpassungsparametern: Konzipieren von Anpassungsparametermechanismen, um die Strategieparameter dynamisch an die Marktlage anzupassen
Zusammenfassen
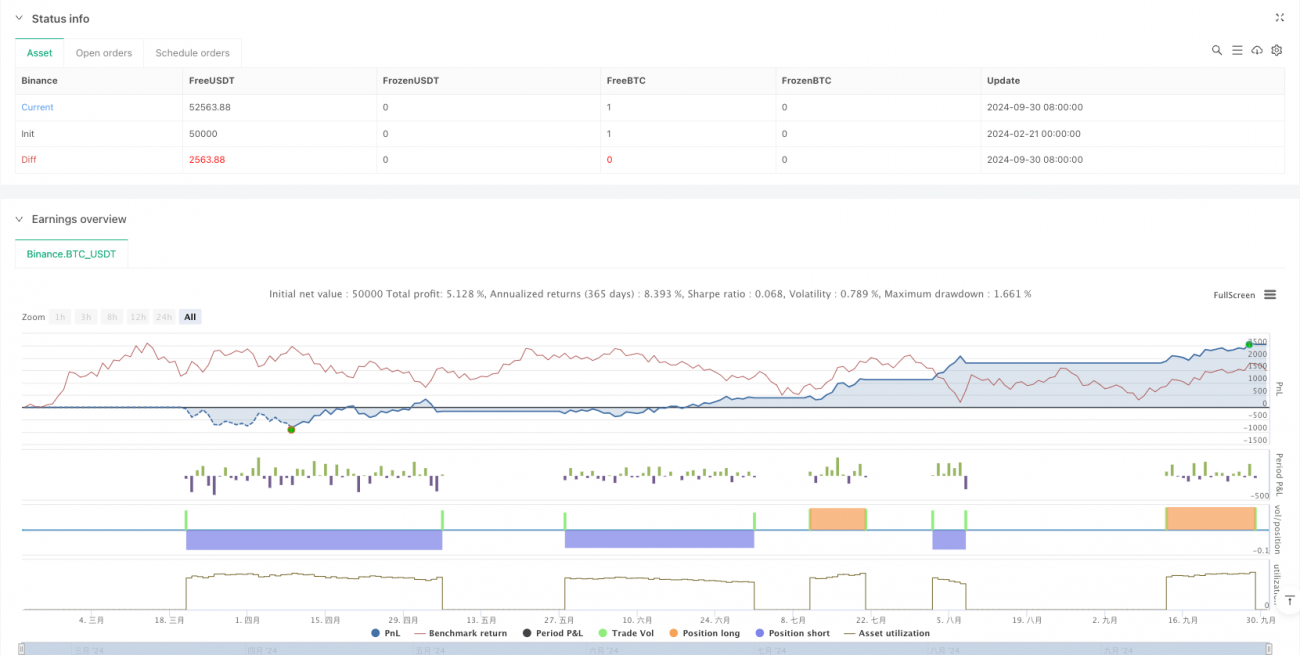
Die Strategie kombiniert Trend-Tracking und Dynamik-Analyse, um ein relativ vollständiges Handelssystem zu bauen. Sie bietet nicht nur klare Ein- und Ausstiegssignale, sondern enthält auch ein Rahmenwerk für Risikomanagement und Parameteroptimierung. Obwohl einige inhärente Risiken bestehen, können die Stabilität und Anpassungsfähigkeit der Strategie durch die Bereitstellung von Optimierungsempfehlungen weiter verbessert werden.
/*backtest
start: 2024-02-21 00:00:00
end: 2024-10-01 00:00:00
period: 2d
basePeriod: 2d
exchanges: [{"eid":"Binance","currency":"BTC_USDT"}]
*/

//@version=5
strategy("SuperTrend + Stochastic Strategy", overlay=true, default_qty_type=strategy.percent_of_equity, default_qty_value=10)

// SuperTrend Settings- 1