
Überblick
Die Strategie ist ein Handelssystem, das Trendverfolgung und Dynamikumkehr kombiniert. Sie beurteilt den Gesamttrend hauptsächlich anhand der 34-Zyklus-EMA-Mittel, identifiziert überkaufte und überverkaufte Bereiche anhand des RSI-Indikators und kombiniert die K-Linie-Form mit dem Transaktionsvolumen, um das Handelssignal zu bestätigen. Die Strategie verwendet eine dynamische Stop-Loss- und Profit-Methode, die auf der ATR basiert und die Handelsparameter an die Marktvolatilität anpassen kann.
Strategieprinzip
Die Kernlogik der Strategie umfasst die folgenden Schlüsselelemente:
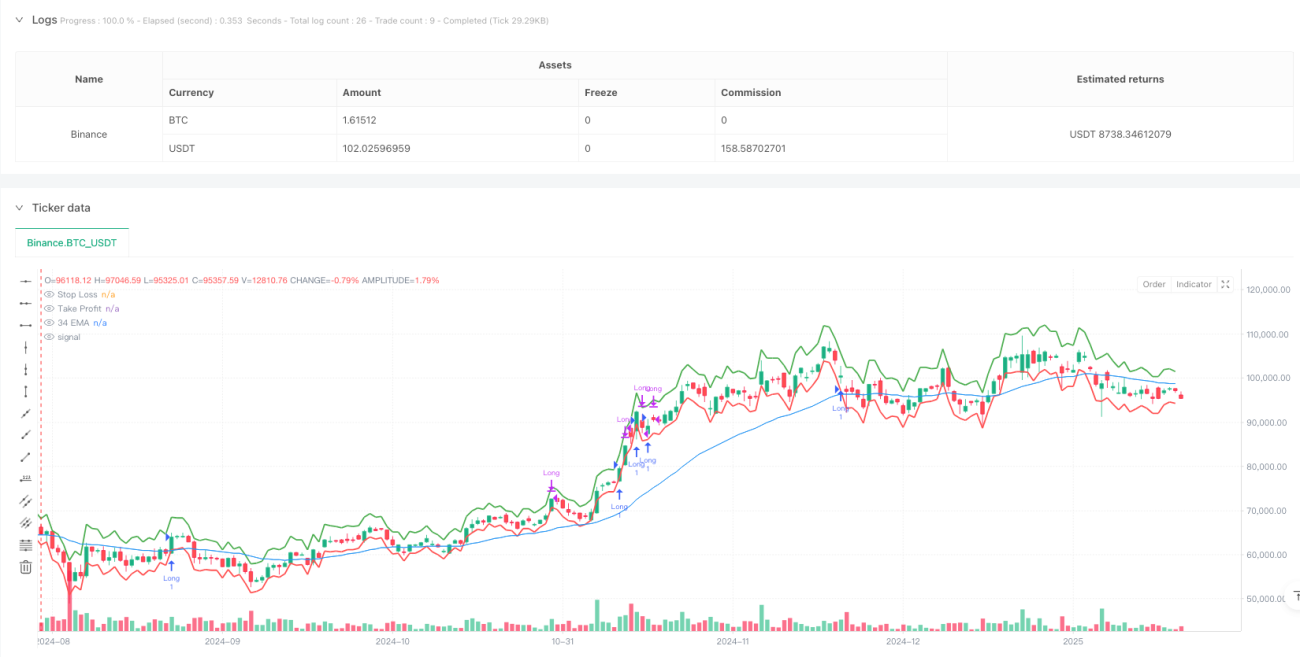
- Trendbeurteilung: Verwenden Sie die 34-Zyklus-EMA als Haupttrendindikator und suchen Sie nur nach mehr Möglichkeiten, wenn der Preis über der EMA liegt
- Zulassungsvoraussetzungen: Es ist eine K-Linie-Kombination von Yin-Yang-Yang erforderlich, d.h. eine Yin-Linie wird von zwei Yang-Linien gefolgt
- Dynamikbestätigung: Dynamikbestätigung mit dem RSI-Indikator, der einen RSI-Wert von mehr als 50 erfordert, um eine Aufwärtsbewegung zu zeigen
- Transaktionsvolumen-Filter: Erfordert, dass die aktuelle Transaktionsmenge größer ist als der 20-Zyklus-Durchschnitt, um eine ausreichende Marktbeteiligung zu gewährleisten
- Risikomanagement: Einsatz von 1,5 mal ATR als Gewinnziel und 1 mal ATR als Stop-Loss-Position
Strategische Vorteile
- Multiple-Signal-Bestätigung: Die Bestätigung von Transaktionen in mehreren Dimensionen, einschließlich Trend, Form, Dynamik und Transaktionsvolumen, kann falsche Signale wirksam reduzieren
- Dynamisches Risikomanagement: Stop- und Take-Loss-Einstellungen basierend auf ATR, die sich automatisch an die Marktvolatilität anpassen können
- Trend-Tracking-Funktion: Sicherung des Handels in Richtung des Haupttrends durch EMA, um die Gewinnrate zu erhöhen
- Flexible Parameter-Einstellungen: Schlüsselparameter wie EMA-Zyklen, RSI-Schwellenwerte, ATR-Multiplikatoren und andere können an unterschiedliche Marktbedingungen angepasst werden
Strategisches Risiko
- Trendwechselrisiko: An einem Trendwechselpunkt kann es zu Folgeverlusten kommen.
- Gefahr eines False-Breaks: K-Line-Form kann zu False-Breaks führen, die zu falschen Signalen führen
- Risiken von Marktschwankungen: Die ATR-Werte können bei starken Schwankungen ungewöhnlich hoch werden und die Stop-Loss-Einstellungen beeinflussen
- Parameter-Sensitivität: Die optimalen Parameter können in unterschiedlichen Marktumgebungen stark variieren
Richtung der Strategieoptimierung
- Hinzufügung von Trendstärke-Filtern: Ein ADX-Indikator, der die Trendstärke misst, kann eingeführt werden, um nur bei starken Trends zu handeln
- Verbesserte Ausstiegsmechanismen: Einsatz von mobilen Stop-Losses, um sowohl die Gewinnspirale als auch den Gewinn zu schützen
- Optimierung der Transaktionsmenge: Erwägen Sie die Verwendung von relativen Transaktionsmengen oder Transaktionsbruchindikatoren
- Erweiterte Zeitfilterung: Zeitfenster für den Handel können hinzugefügt werden, um volatile Zeiten zu vermeiden
- Einführung einer Klassifizierung der Marktumgebung: Anpassung der Strategieparameter an die unterschiedlichen Marktumgebungsdynamiken
Zusammenfassen
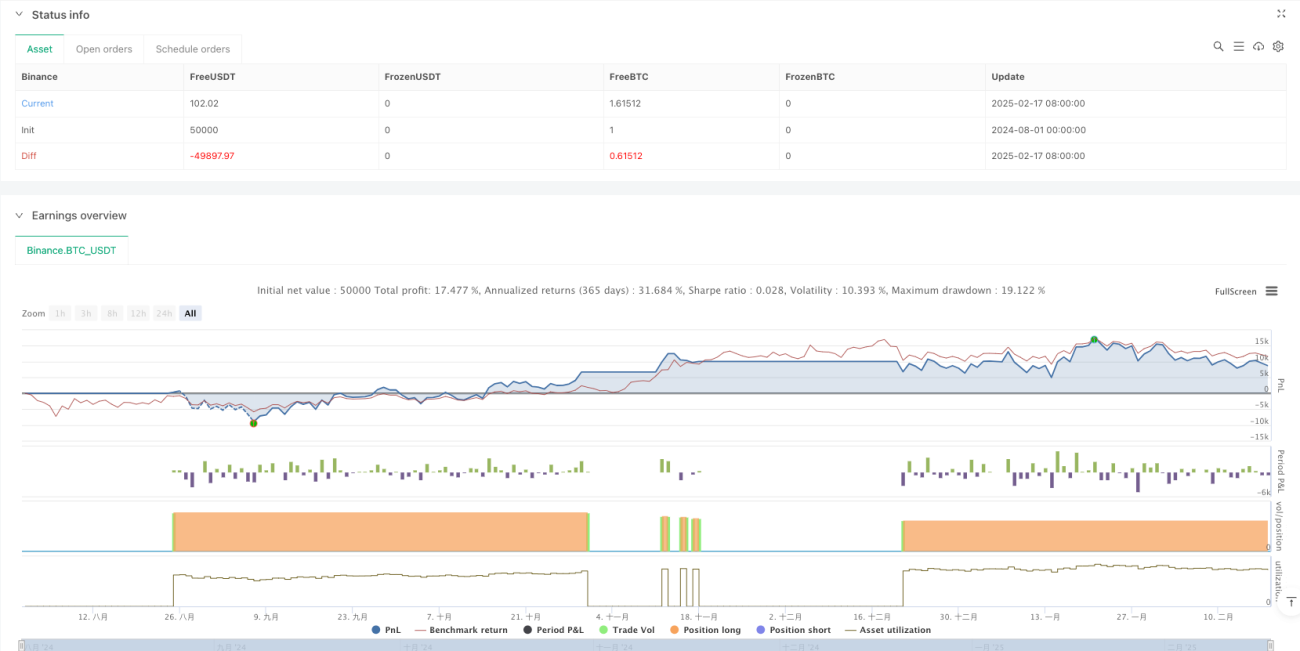
Die Strategie baut durch die Kombination mehrerer technischer Kennzahlen ein vollständiges Handelssystem auf, das eine gute Anpassungsfähigkeit und Skalierbarkeit aufweist. Die Kernvorteile der Strategie liegen in der mehrdimensionalen Signalerkennung und dem dynamischen Risikomanagement, wobei jedoch auch auf die Optimierung der Parameter und die Anpassungsfähigkeit der Marktumgebung geachtet werden muss. Durch kontinuierliche Optimierung und Verbesserung wird die Strategie in der Lage sein, in verschiedenen Marktumgebungen eine stabile Leistung zu erzielen.
- 1