
Überblick
Die Strategie ist ein Multi-Time-Frame-Band-Trading-System, das auf einem Stochastic Oscillator basiert. Es identifiziert Handelschancen durch die Kombination von Zufallssignal aus dem aktuellen und höheren Zeitrahmen und verwendet dynamische Stop-Loss-Systeme, um Risiken zu verwalten. Die Strategie ist für volatile Märkte geeignet, um durch die Erfassung von kurzfristigen Preisschwankungen zu profitieren.
Strategieprinzip
Die Kernlogik der Strategie basiert auf den folgenden Schlüsselelementen:
- Signalbestätigung mit Zufallsindikatoren in zwei Zeiträumen (aktueller und höherer Ebene)
- Auf der Suche nach Kreuzungen in Überkauf- und Überverkaufszonen
- Kaufbedingungen: D-Leitung auf der aktuellen Zeitrahmen-K-Linie mit einem K-Wert < 20; höherer Zeitrahmen mit einem K-Wert < 20 und K> D
- Verkaufsbedingungen: Unterhalb des aktuellen Zeitrahmens K durch D, wenn der Wert von K > 80 ist; höherer Zeitrahmen, wenn der Wert von K > 80 und K < D ist
- Ein dynamisches Stop-Loss-System basierend auf dem Einstiegspreis, mit einstellbarem Stop-Loss-Multiplikator
Strategische Vorteile
- Multi-Time-Frame-Signal-Bestätigung erhöht die Zuverlässigkeit von Transaktionen und reduziert die Falschsignale wirksam
- Die Wahrscheinlichkeit einer Trendwende erhöht sich durch den Handel in Überkauf- und Überverkaufszonen.
- Dynamische Stop-Loss-Systeme, die sich automatisch an Marktschwankungen anpassen, erhöhen die Flexibilität der Geldverwaltung
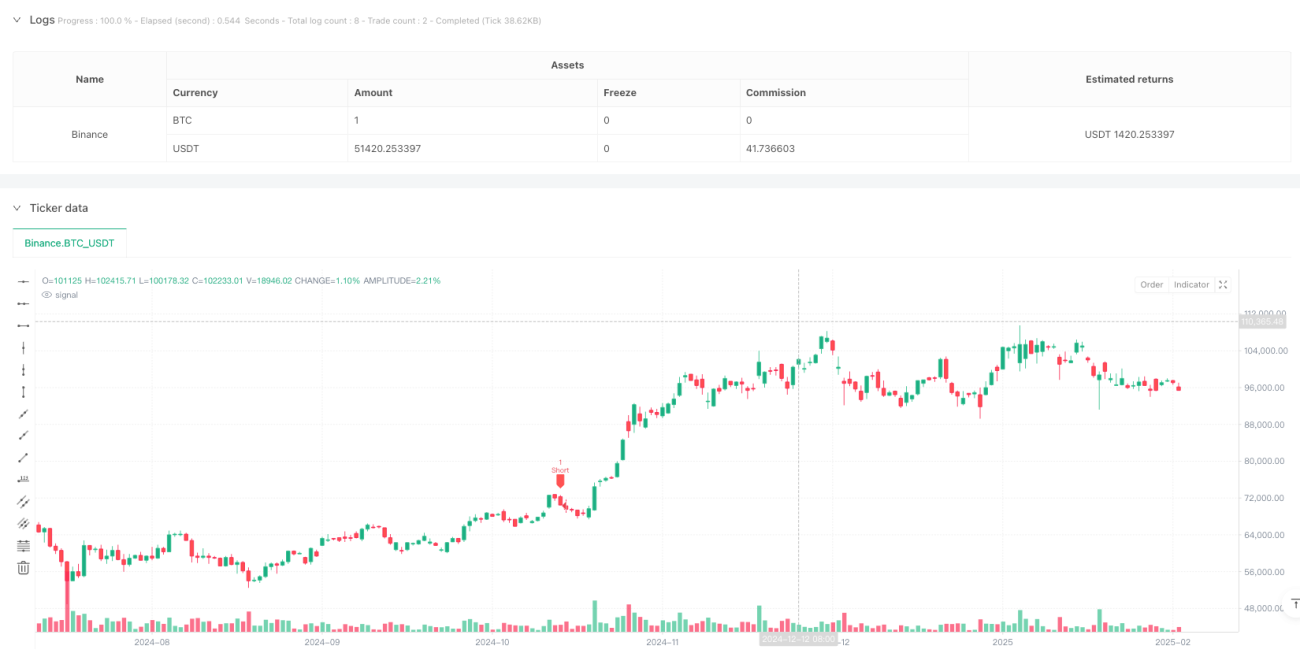
- Graphische Oberfläche, die Trading-Signale und Stop-Loss-Positionen intuitiv darstellt, um den Händler zu verstehen und zu bedienen
- Strategieparameter sind anpassbar für unterschiedliche Marktumstände
Strategisches Risiko
- Häufige Stop-Loss-Fälle in stark bewegten Märkten
- Doppelte Zeitrahmen-Bestätigung kann zu verpassten Handelschancen führen
- Ein Stop-Loss mit einem festen Multiplikator ist möglicherweise nicht für alle Marktbedingungen geeignet.
- Eine zu frühzeitige Einstellung bei einem starken Trend
- Die Parameter müssen vernünftig eingestellt werden, um Gewinne und Risiken auszugleichen.
Richtung der Strategieoptimierung
- Einführung eines adaptiven Stop-Loss-Mechanismus, der sich dynamisch an Marktfluktuationen anpasst
- Hinzufügen von Trendfiltern, um die Richtung des Handels bei starken Trends zu ändern
- Hinzufügen von Transaktionszahlen als Hilfsbestätigungssignal
- Entwicklung eines intelligenten Lagerverwaltungssystems
- Erwägen Sie die Einbeziehung von Market Sentiment Indicators zur Optimierung der Eintrittszeit
Zusammenfassen
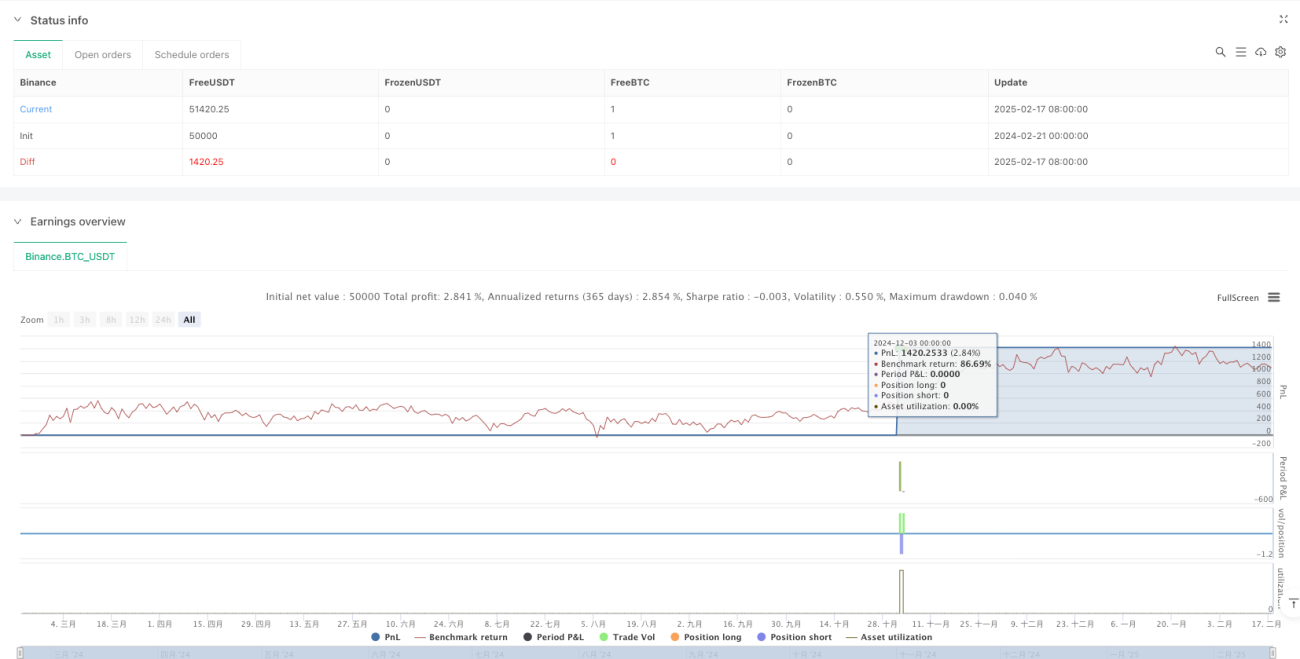
Es ist ein vollständiges Handelssystem, das technische Analyse und Risikomanagement kombiniert. Die Strategie bietet eine gute Gewinnpotenziale, während die Stabilität durch Signalbestätigung und dynamische Stop-Loss in mehreren Zeitrahmen gewährleistet wird. Der Benutzer muss jedoch die Parameter entsprechend seinem Trading-Stil und der Marktumgebung optimieren und stets eine strenge Risikokontrolle beibehalten.
- 1