
Überblick
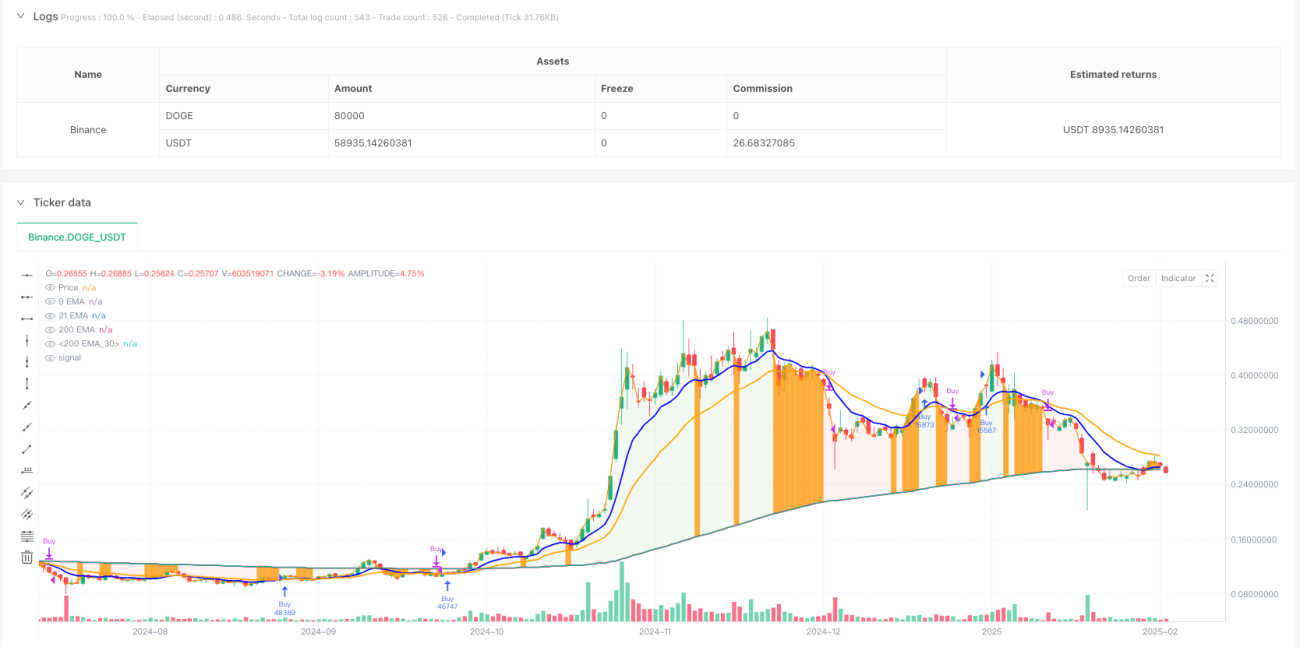
Die Strategie ist ein Trend-Tracking-Trading-System, das auf Multiple-Index-Moving Averages (EMA) und Cloud-Visualisierungen basiert. Die Strategie verwendet 9-Zyklus-, 21-Zyklus- und 200-Zyklus-Triple-EMA, um Markttrends anhand der positiven Beziehung zwischen dem Preis und der Erweiterung sowie der Kreuzung zwischen den Erweiterungen zu beurteilen und bei Trendbestätigung ein Handelssignal auszusenden. Das System zeigt die Trendsituation des Marktes intuitiv anhand der Farbänderungen der Clouds.
Strategieprinzip
Die Kernlogik der Strategie basiert auf den folgenden Schlüsselelementen:
- Trend-Framework mit dreifacher EMA (9.21/200)
- Kurzfristige Trends werden durch die Beziehung zwischen dem Preis und der 9. EMA sowie der Beziehung zwischen der 9. EMA und der 21. EMA beurteilt
- Die 200-Tage-EMA als langfristige Trendlinie
- Wenn der Preis eine 9-Tage-EMA und eine 9-Tage-EMA eine 21-Tage-EMA überschreitet, entsteht eine grüne Wolke, die ein bullishes Signal darstellt
- Wenn der Preis die 9-Tage-EMA durchbricht und die 9-Tage-EMA die 21-Tage-EMA durchbricht, entsteht eine rote Wolke, die ein Abwärtstrendsignal darstellt
- Die Generierung von Handelssignalen basiert auf der Veränderung der Farbe der Wolken, wobei die grünen Wolken die Position öffnen und die roten Wolken die Position platzieren.
Strategische Vorteile
- Mehrfache Zeitrahmenanalyse: Markttrends durch die Kombination von EMAs in verschiedenen Zeitspannen
- Visuelle Intuition: Die Farbänderungen der Wolken zeigen die Marktsituation deutlich und unterstützen die Handelsentscheidung
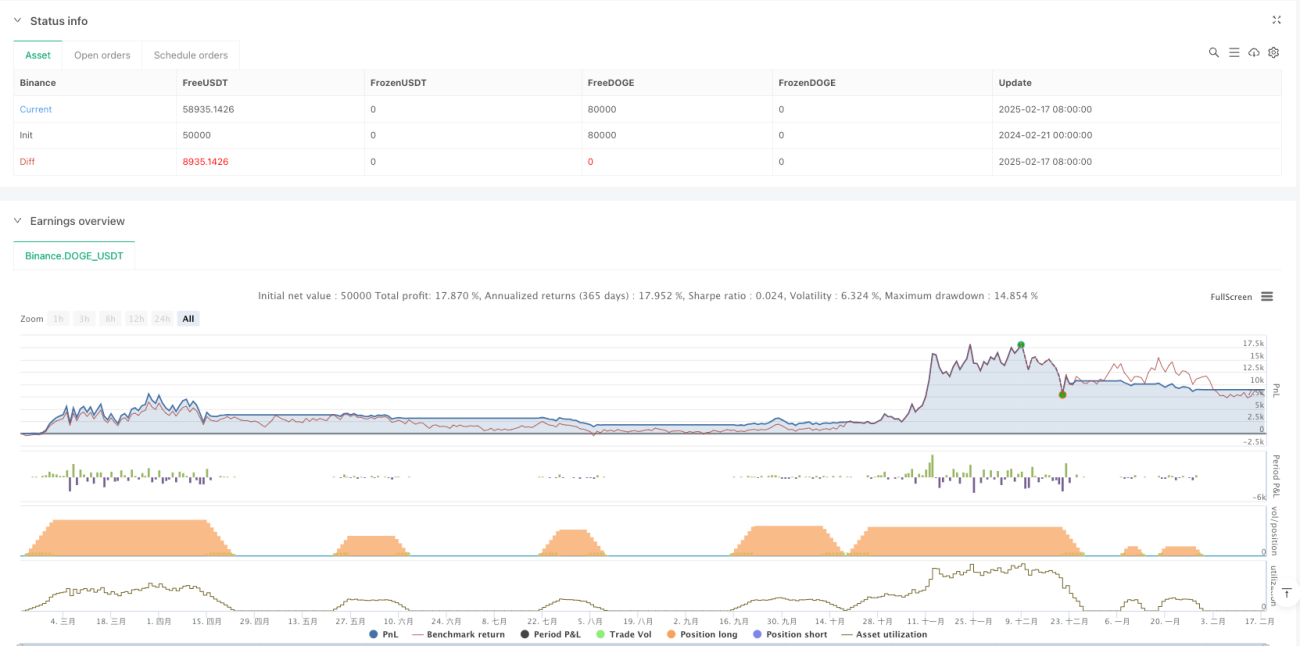
- Trendbestätigung: Mehrfachbestätigung zur Verringerung des Risikos von Falschmeldungen
- Anpassungsfähigkeit: Die EMA legt mehr Wert auf die aktuellsten Preise und kann sich schneller an Marktveränderungen anpassen
- Risikokontrolle: Ein System, das Trends zurückdrängt, und Ausfallmechanismen, um Verluste effektiv zu kontrollieren
Strategisches Risiko
- Marktrisiken: Häufige Falschsignale während der Quer-Strecken-Phase
- Rückstandsrisiko: Einheitliche Systeme haben einen gewissen Rückstand und können die besten Einstiegspunkte verpassen
- Trendwechselrisiko: Bei einer plötzlichen Umkehrung des starken Trends kann es zu einem größeren Rückzug kommen.
- Parameter-Sensitivität: Die optimalen Parameter können in unterschiedlichen Marktumgebungen variieren
- Cloud-Risiko: Nur auf die Farbe der Wolken zu vertrauen, kann andere wichtige Marktsignale übersehen
Richtung der Strategieoptimierung
- Erhöhung der Bestätigung von Transaktionen: Einführung von Transaktionsindikatoren, um die Trendwahrnehmung zu verbessern
- Optimierungsparameter sind anpassungsfähig: EMA-Parameter werden dynamisch an Marktschwankungen angepasst
- Einführung eines Stop-Loss-Mechanismus: Einrichtung eines mobilen oder festen Stop-Losses zur besseren Risikokontrolle
- Filter hinzufügen: Hinzufügen von Indikatoren wie ATR oder RSI, um falsche Signale zu filtern
- Verbesserte Ausstiegsmechanismen: Flexiblere Entwurfsprozesse für die Gewinnung
- Optimierung der Positionsverwaltung: Dynamische Anpassung der Positionsanteile an die Trendstärke
Zusammenfassen
Die Multiple Equilibrium Cloud Trend Trading Strategie ist ein vollständiges Handelssystem, das technische Analyse und visuelle Rückmeldungen kombiniert. Durch die Kombination von Multiple EMAs kann nicht nur der Markttrend effektiv erfasst werden, sondern auch die Marktsituation in Form einer Wolke visuell dargestellt werden. Obwohl ein gewisses Risiko von Verzögerungen und Falschsignalen besteht, kann die Strategie mit geeigneten Optimierungs- und Risikokontrollmaßnahmen zu stabilen Erträgen in Trendmärkten führen.
- 1