Supertrend Enhanced Engulfing Pattern Dynamische Risikokontrollstrategie

Überblick
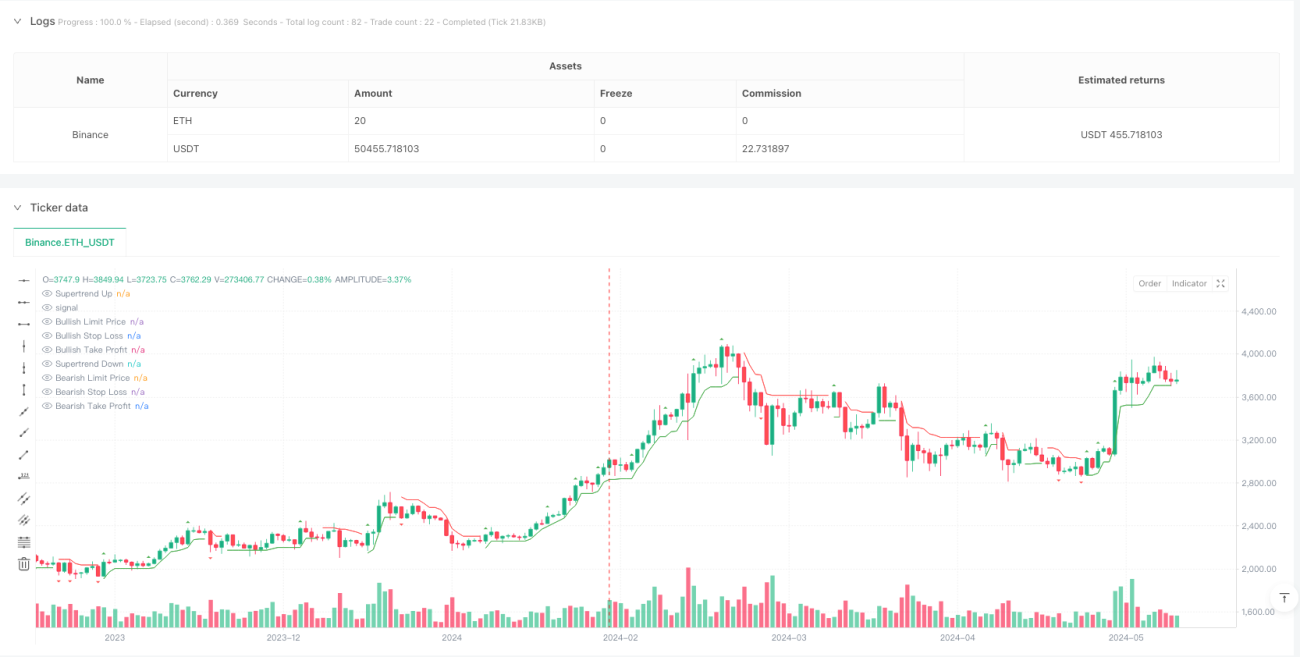
Dies ist eine hochwertige Handelsstrategie, die den Supertrend-Indikator und die Verschluckform kombiniert. Die Strategie ermöglicht eine genaue Auswahl von Handelssignalen durch die Identifizierung von Verschluckform-Plattform-Mustern im Markt und die Bestätigung der Trendrichtung in Verbindung mit dem Supertrend-Indikator. Die Strategie integriert auch dynamische Stop-Loss- und Profit-Einstellungen, um das Risiko effektiv zu kontrollieren und gleichzeitig den Gewinn zu sichern.
Strategieprinzip
Die Strategie basiert hauptsächlich auf folgenden Kernprinzipien:
- Der Supertrend-Indikator wird mit dem ATR (Average True Rate) berechnet, um die allgemeine Marktentwicklung zu bestimmen.
- Filtern Sie die effektiven Engulf-Formen aus, indem Sie den Boring Candle Threshold und den Engulfing Candle Threshold festlegen.
- Der Supertrend tritt nur dann auf, wenn die Richtung des Trends mit der der Verschluckform übereinstimmt.
- Die Stop-Loss- und Take-Profit-Positions sind dynamisch eingestellt und werden prozentual auf Basis des Eröffnungspreises berechnet.
- Mit strategischer Positionsverwaltung wird sichergestellt, dass nur eine Handelsrichtung gleichzeitig gehalten wird.
Strategische Vorteile
- Die Signalqualität wird streng kontrolliert und die Genauigkeit durch die doppelte Bestätigung ((Trend + Form)) erhöht.
- Die Einführung von Langeweile und Engulf-Threshold-Konzepten, um falsche Signale effektiv zu filtern.
- Die dynamische Supertrend-Berechnung basiert auf dem ATR, was die Strategie zu einer guten Marktadaptivität macht.
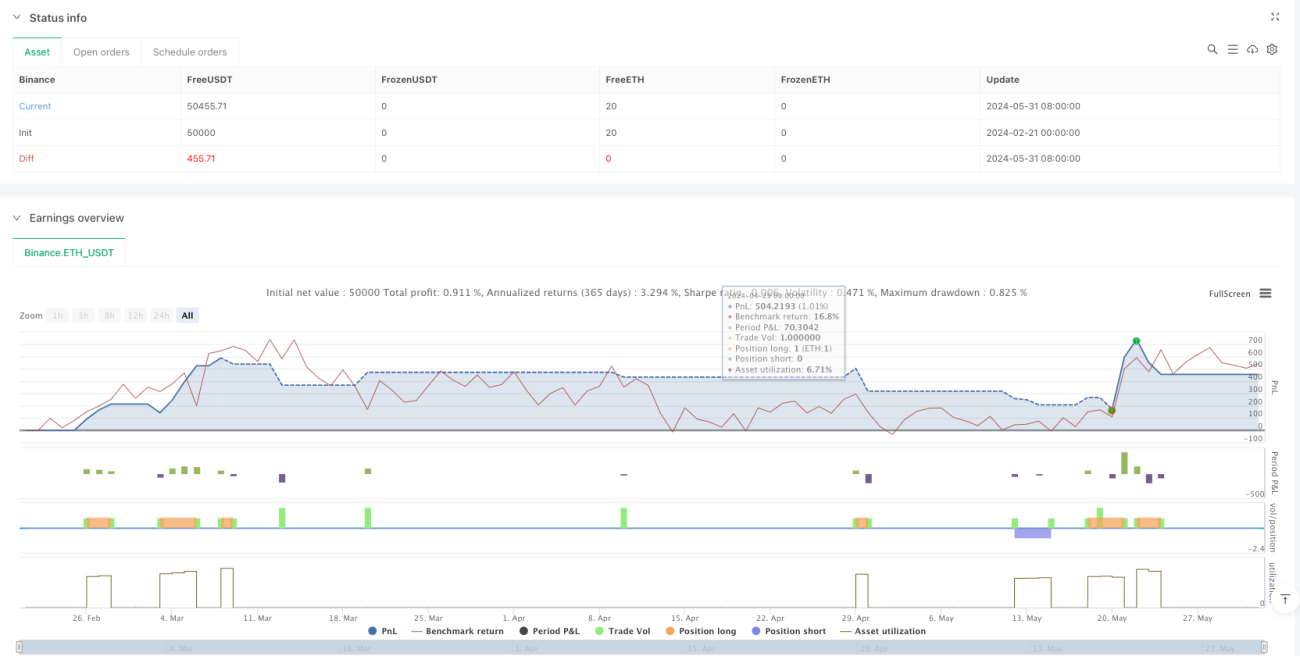
- Gute Stop-Loss- und Profit-Management-Mechanismen, die sowohl Risiken als auch Gewinne kontrollieren.
- Die Visualisierung ist perfekt, die Handelssignale, die Stop-Loss-Punkte und die Gewinnziele sind klar sichtbar.
Strategisches Risiko
- In den meisten Fällen ist es jedoch möglich, dass sich der Markt in einem unsicheren Zustand befindet.
- Die Fixed Stop-Loss- und Take-Profit-Einstellungen sind möglicherweise nicht für alle Marktbedingungen geeignet.
- Ein weiterer Trendwechsel könnte zu einem größeren Rückschlag führen.
- Die Einstellung von Parametern ist empfindlich, und falsche Parameter können zu einer schlechten Strategie führen.
- In weniger liquiden Märkten besteht die Gefahr eines Ausrutsches.
Richtung der Strategieoptimierung
- Die Einführung von Transfertindikatoren kann als Signalbestätigung dienen.
- Überlegen Sie, ATR-Multiplikator-Regulierungsmechanismen für dynamische ATR-Multiplikatoren einzusetzen.
- Die Stop-Loss- und Profit-Ratio wird dynamisch an die Marktfluktuation angepasst.
- Die Zeit-Filter werden hinzugefügt, um zu vermeiden, dass der Handel in unpassenden Zeiträumen stattfindet.
- Erwägen Sie, einen Trendstärkenfilter hinzuzufügen, um die Qualität des Handels zu verbessern.
Zusammenfassen
Es handelt sich um eine sorgfältig konzipierte, logisch klare Strategie, die durch die Kombination von technischen Indikatoren und Formanalyse eine bessere Signalqualitätskontrolle ermöglicht. Die Risikomanagementmechanismen der Strategie sind vervollständigt, die Visualisierung wirkt hervorragend und eignet sich für Tests und Optimierungen in der Praxis.
- 1