Dynamische EMA Crossover Swing High Low Adaptive Strategie

Überblick
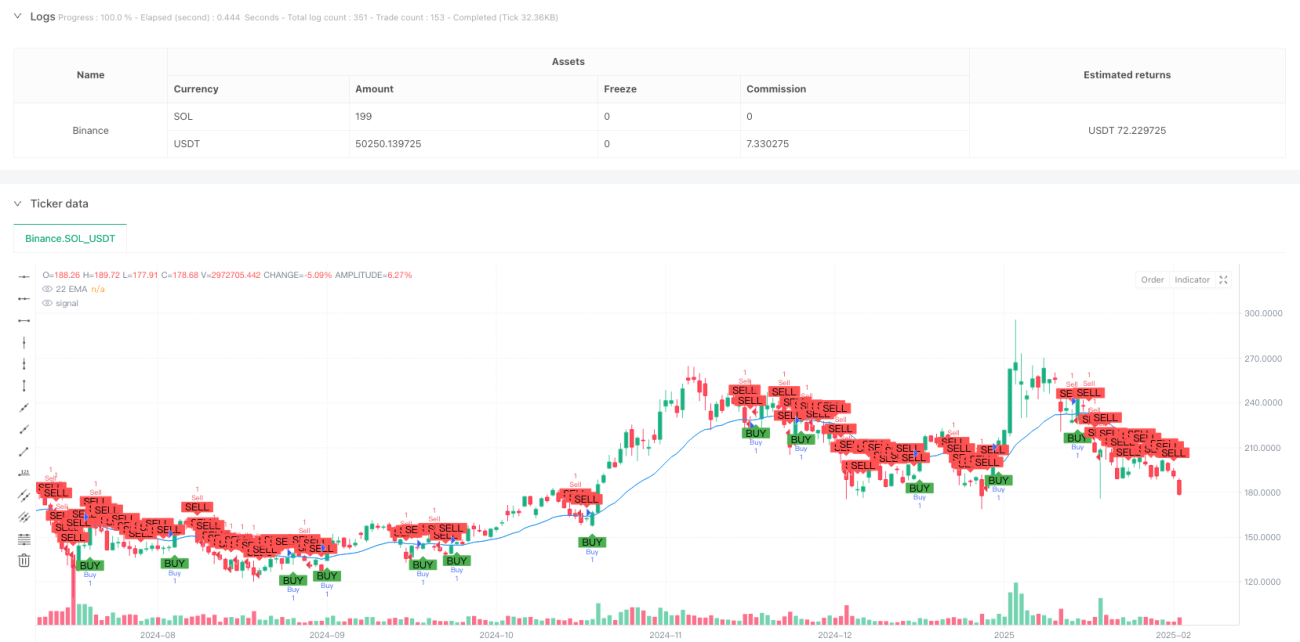
Die Strategie ist ein Handelssystem, das auf dem 22-periodigen Index Moving Average (EMA) basiert. Es erzeugt Handelssignale durch die Kreuzung von Preisen mit EMAs und verwendet adaptive Schwingungshöhen und Tiefen, um Stop-Loss-Positionen zu setzen. Diese Methode garantiert sowohl die grundlegenden Funktionen des Trend-Trackings als auch die Flexibilität des Risikomanagements.
Strategieprinzip
Die Kernlogik der Strategie umfasst die folgenden Schlüsselelemente:
- Mit der 22-Zyklus-EMA als Haupttrendindikator filtert dieser Zyklus besser den Marktrauschen
- Wenn der Schlusskurs die EMA überschreitet, wird ein Mehrsignal ausgelöst, wenn der Schlusskurs die EMA überschreitet, wird ein Leersignal ausgelöst
- Hochs und Tiefs durch Berechnung von historischen Daten über 14 Zyklen
- Übertrieben mit dem jüngsten schwankenden Höchstwert als Stop-Loss-Ziel und dem schwankenden Tiefpunkt als Stop-Loss-Ziel
- Leerhandel mit dem jüngsten schwankenden Tief als Stop-Loss-Ziel und einem schwankenden Hoch als Stop-Loss
Strategische Vorteile
- Trendadaptivität: Die 22-Perioden-EMA ist in der Lage, die mittelfristigen Trends effektiv zu erfassen und zu häufige Transaktionen zu vermeiden
- Dynamisches Risikomanagement: Die Stop-Loss-Position wird automatisch an Marktbewegungen angepasst, was die Anpassungsfähigkeit der Strategie erhöht
- Klarheit der Ausführung: Die Handelssignale sind klar, es gibt keine unklaren Bereiche für die Beurteilung
- Gewinne-Risiko-Verhältnis ist angemessen: Durch die Schwingung des Stop-Loss-Satzes wird ein relativ stabiler Gewinne-Risiko-Verhältnis für jeden Handel gewährleistet
- Gute Visualisierung: Die Strategie liefert klare visuelle Signale, die von Händlern besser verstanden und überwacht werden können
Strategisches Risiko
- Schwankungsrisiko: Häufige Falschbrüche in schwankenden Märkten
- Risiko einer Abweichung: In Zeiten starker Schwankungen kann der tatsächliche Kaufpreis stark von dem Signalpreis abweichen
- Die Risiken des Marktes können zu Stop-Loss-Unterbrechungen führen, die zu übererwarteten Verlusten führen.
- Trendwechselrisiko: Es kann zu einer Folge von Verlusten in der Nähe eines wichtigen Trendwechselpunktes kommen.
Richtung der Strategieoptimierung
- Einführung von Traffic Indicators: Die Zuverlässigkeit des Signals kann anhand von Traffic bestätigt werden
- Hinzufügen von Trendfiltern: Bewegliche Durchschnitte mit längeren Perioden, um Gegentrendsignale zu filtern
- Optimierung des Stop-Loss-Verfahrens: Eine dynamische Einstellung des Stop-Loss-Abstands mit ATR kann in Betracht gezogen werden
- Zeit-Filter hinzugefügt: Verbot der Eröffnung von Positionen in bestimmten Zeiträumen, um schwankende Zeiten zu vermeiden
- Entwicklung von Signalbestätigungsmechanismen: in Kombination mit anderen technischen Indikatoren zur Signalbestätigung, um die Siegertheorie zu verbessern
Zusammenfassen
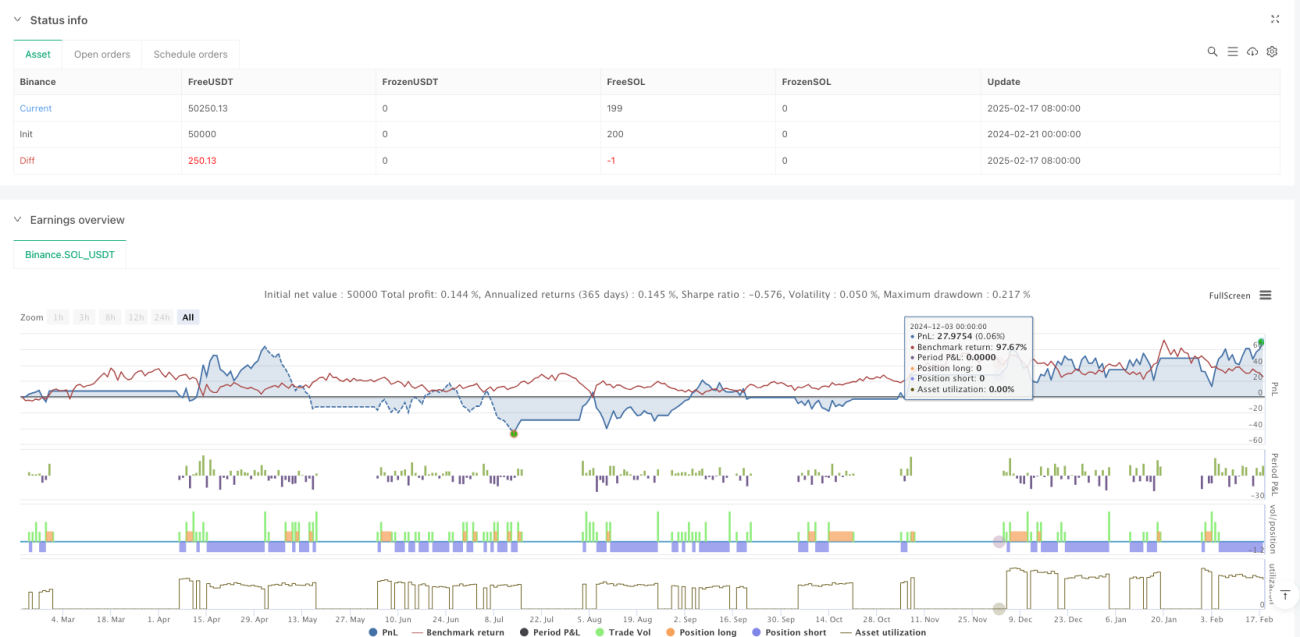
Es handelt sich um eine strukturierte, logisch klare Trendverfolgungsstrategie. Durch die Kreuzung von EMAs wird ein Handelssignal erzeugt, das die Risiken der Schwankungen nutzt, um ein ausgewogenes Handelssystem zu bilden. Der Hauptvorteil der Strategie liegt in ihrer Fähigkeit, sich dynamisch an die Märkte anzupassen, während das Hauptrisiko aus Veränderungen der Marktlage resultiert. Die Stabilität und Profitabilität der Strategie werden durch die empfohlene Optimierungsrichtung voraussichtlich weiter verbessert.
- 1