
Überblick
Die Strategie ist ein quantitatives Handelssystem, das mehrere technische Indikatoren kombiniert und die drei klassischen technischen Indikatoren durch den Moving Average (MA), den relativ starken Indikator (RSI) und den Moving Average Trend Scatter (MACD) zusammenführt, um ein vollständiges Handelssignalsystem zu erstellen. Die Strategie verwendet eine Kombination aus Trendverfolgung und Dynamikerkennung, um die richtige Handelsrichtung zu gewährleisten und gleichzeitig die Gelegenheit zu erfassen.
Strategieprinzip
Die Strategie basiert auf der Konstruktion von Handelssignalen auf drei Ebenen:
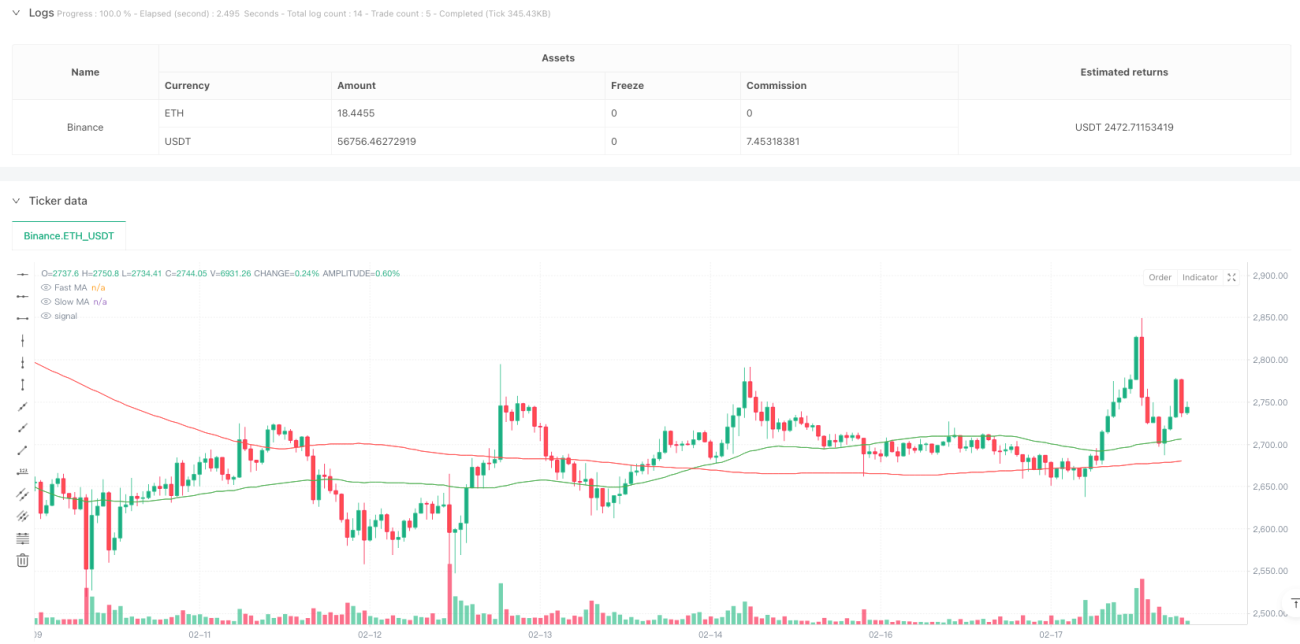
- Trendbeurteilung: Verwendung des 50-Tage- und 200-Tage-Doppel-Gleichlinien-Systems, um die Richtung des großen Trends durch Gold- und Todesforken zu bestimmen
- Dynamikbestätigung: Kombination des RSI-Überkauf-Überverkauf-Levels (70/30) mit dem MACD-Goldfork, um die Preisdynamik zu überprüfen
- Risikokontrolle: Setzen Sie 2% Stop Loss, 4% Stop Stop und 1% Tracking Stop Loss, um ein vollständiges Risikomanagementsystem aufzubauen
Konkret, wenn die schnelle Durchschnittslinie ((50-Tage) über die langsame Durchschnittslinie ((200-Tage) gebildet Goldfork, während der RSI nicht überkaufen Ebene erreicht und MACD gebildet Goldfork, das System erzeugt ein Plus-Signal. Umgekehrt, wenn ein Dead-Fork auftritt und der RSI nicht überkaufen Ebene erreicht, MACD gebildet Dead-Fork, das System erzeugt ein Shutdown-Signal.
Strategische Vorteile
- Hohe Signalzuverlässigkeit: Durch Multi-Meter-Cross-Verifizierung kann ein falsches Signal effektiv gefiltert werden
- Trends sind präzise zu erfassen: Das klassische Doppel-Linien-System erlaubt es, wichtige Trends besser zu erfassen
- Risikokontrolle: Integration von verschiedenen Stop-Loss-Methoden, um das Abwärtsrisiko effektiv zu kontrollieren
- Anpassungsfähigkeit: Strategieparameter sind anpassungsfähig und können sich an unterschiedliche Marktbedingungen anpassen
- Klarheit der Ausführung: Die Signalerzeugungsbedingungen sind klar und vermeiden die Störungen durch subjektive Beurteilung
Strategisches Risiko
- Verzögerungsrisiko: Der gleitende Durchschnitt selbst weist Verzögerungen auf und Sie verpassen möglicherweise den besten Einstiegszeitpunkt.
- Schwankungsrisiko: False Durchbruchsignale können häufig in schwankenden Märkten auftreten
- Risiken der Parameteroptimierung: Überoptimierte Parameter können zu einer Überpassung führen, die die Stabilität der Strategie beeinträchtigt
- Kostenkontrolle: Häufige Transaktionen können zu hohen Transaktionskosten führen
- Marktumfeldabhängigkeit: Strategien, die in einem Markt mit deutlichen Trends besser abschneiden, aber in anderen Marktumgebungen möglicherweise nicht so gut funktionieren
Richtung der Strategieoptimierung
- Einführung von Übertragungsindikatoren: Erhöhung der Übertragungsbestätigung in bestehenden Signalsystemen und Verbesserung der Signalsicherheit
- Optimierung der Anpassung von Parametern: Entwicklung von dynamischen Anpassungsmechanismen für Parameter, um die Anpassung von Strategien an den Markt zu verbessern
- Erhöhung der Stimmungsindikatoren: Einführung von Stimmungsindikatoren wie VIX und Optimierung der Eintrittszeit
- Verbesserung der Stop-Loss-Mechanismen: Entwicklung von flexibleren Stop-Loss-Systemen, wie beispielsweise dynamische Stop-Loss-Systeme auf ATR-Basis
- Hinzufügen von Volatilitätsfiltern: Positionsanpassung bei hoher Volatilität zur Optimierung des Risikos-Gewinn-Verhältnisses
Zusammenfassen
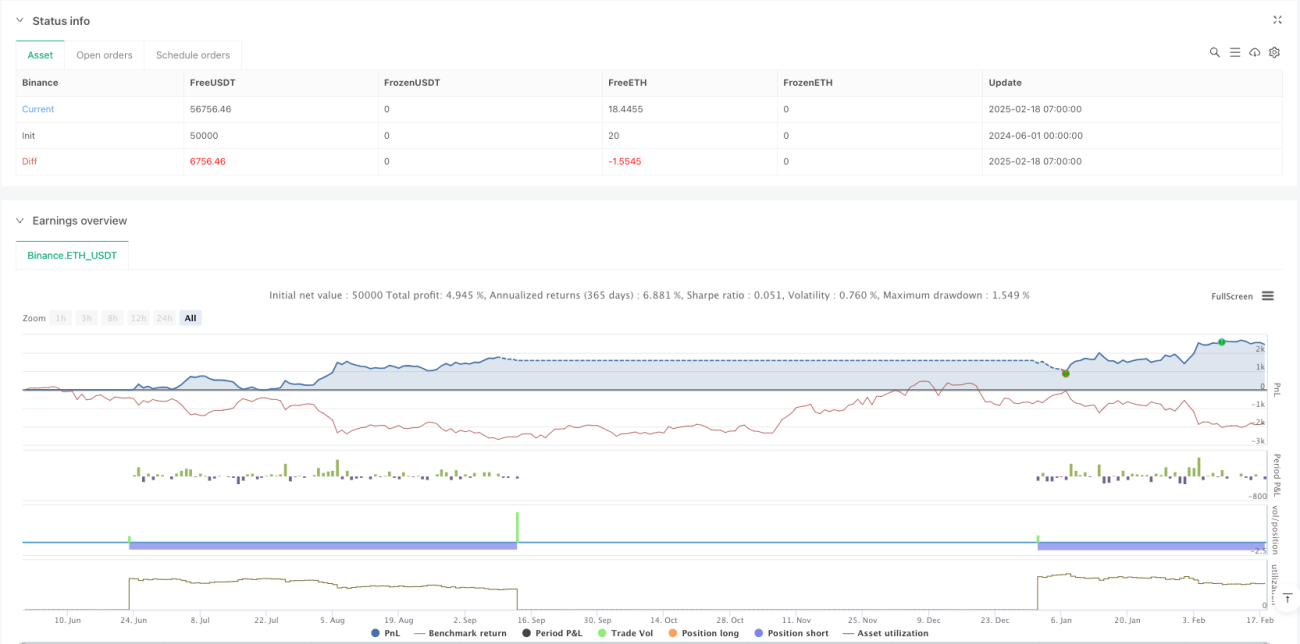
Die Strategie arbeitet mit mehreren technischen Indikatoren zusammen und baut ein relativ vollständiges Handelssystem auf. Die Strategie funktioniert gut in trendschaffenden Märkten, muss aber immer noch an die tatsächlichen Marktbedingungen angepasst werden. Es wird empfohlen, dass die Händler, wenn sie in der Praxis verwendet werden, zuerst eine ausreichende Rückmeldung überprüfen und die Parameter an ihre eigene Risikoverantwortung anpassen.
- 1