
Überblick
Die Strategie ist ein Multi-Indikator-Synthetic Trading-System, das technische Indikatoren wie den Index Moving Average (EMA), den Relativ Strong Indicator (RSI) und den Average True Range (ATR) kombiniert und den Average Trend Indicator (ADX) eingeführt hat, um die Genauigkeit der Trendbeurteilung zu erhöhen. Das System bestätigt die Zeit für die Positionierung durch mehrere Signale und nutzt die ATR, um die Stopps und Stopps dynamisch zu verwalten und die Risiken effektiv zu kontrollieren.
Strategieprinzip
Der Kern der Strategie besteht darin, Markttrends zu erfassen und mit einer Kombination aus mehreren technischen Indikatoren zu handeln.
- Verwenden Sie die EMA mit schnellen 20 und langsamen 50 Zyklen, um die Richtung des Trends zu bestimmen
- In Kombination mit dem ADX ([Zyklus 14]) wird die Trendstärke bestätigt, wobei ein ADX> 20 erforderlich ist, um den Trend zu bestätigen.
- Der RSI benutzt die 14er-Zyklus-RSI, um überkaufende und überverkaufende Gelegenheiten zu finden.
- Die dynamische Stop-Loss- und Stop-Stop-Position wird mit ATR (14 Zyklen) berechnet, wobei das Risiko-Gewinn-Verhältnis auf 2:1 festgelegt ist.
Strategische Vorteile
- Mehrfache Signalbestätigung erhöht die Genauigkeit von Transaktionen und verhindert falsche Signale
- Die Einführung des ADX-Indikators erhöht die Zuverlässigkeit der Trendbeurteilung
- Dynamische Stop-Loss-Stopp-Mechanismen für die Anpassung an Veränderungen in der Marktvolatilität
- Strenge Risikokontrollen sorgen dafür, dass die Risiken für jede Transaktion kontrolliert werden
- Die Strategielogik ist klar und die Parameter sind hochgradig anpassbar
Strategisches Risiko
- Mehrfache Kennzahlen können zu Signalverzögerungen führen, die Eintrittszeiten beeinträchtigen
- Häufige Transaktionen in einem wackligen Markt
- Der ADX-Indikator kann unter bestimmten Marktbedingungen verzögerte Signale erzeugen
- Die Parameter-Einstellungen müssen für verschiedene Marktumstände optimiert werden
Richtung der Strategieoptimierung
- Erwägen Sie die Einbeziehung von Transaktionsvolumenindikatoren, um die Signalsicherheit zu verbessern
- Einführung eines Marktfluktuationsfilters, um Positionen während hoher Volatilität zu korrigieren
- Entwicklung von Anpassungsparametermechanismen, die sich dynamisch an die Marktlage anpassen
- Steigerung der Trendstärke und dynamische Positionsverwaltung
- Optimierung der Stop-Loss-Stop-Logik, Einführung eines mobilen Stop-Loss-Mechanismus
Zusammenfassen
Die Strategie baut durch die organische Kombination von mehreren technischen Indikatoren ein vollständiges Trend-Tracking-Trading-System auf. Die Strategie gewährleistet die Sicherheit des Handels durch strenge Risikokontrollen, während die Genauigkeit des Handels gewährleistet wird. Obwohl ein gewisser Optimierungsraum besteht, hat der Gesamtrahmen einen guten praktischen Wert und eine gute Skalierbarkeit.
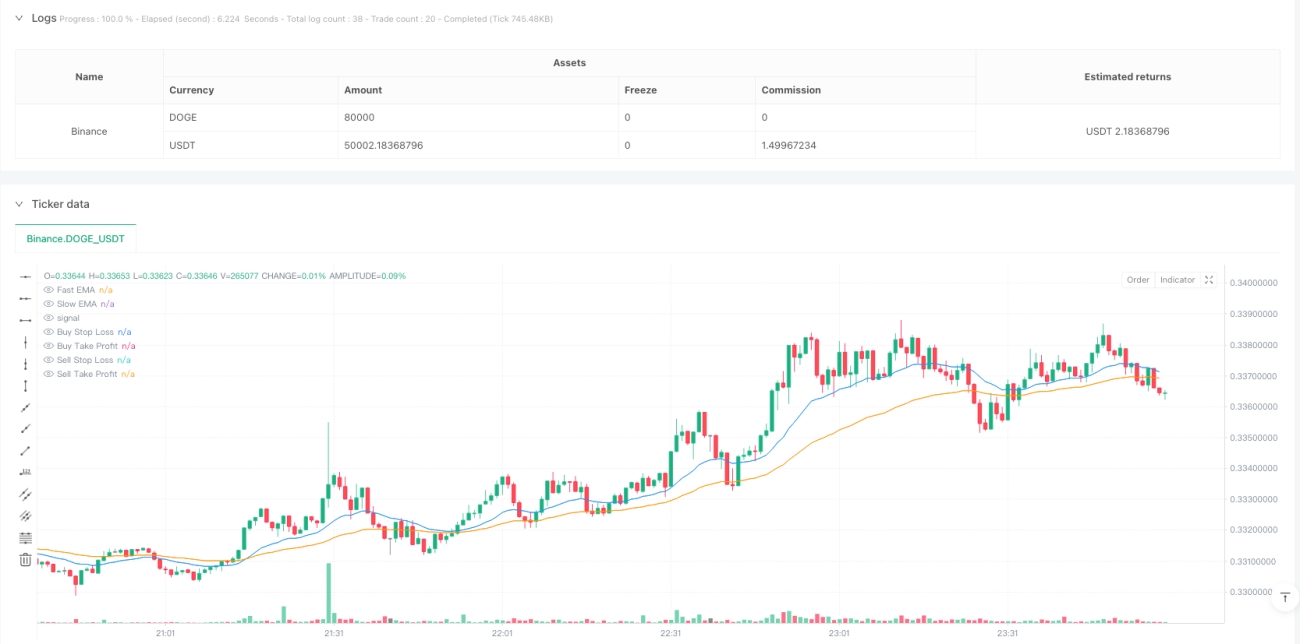
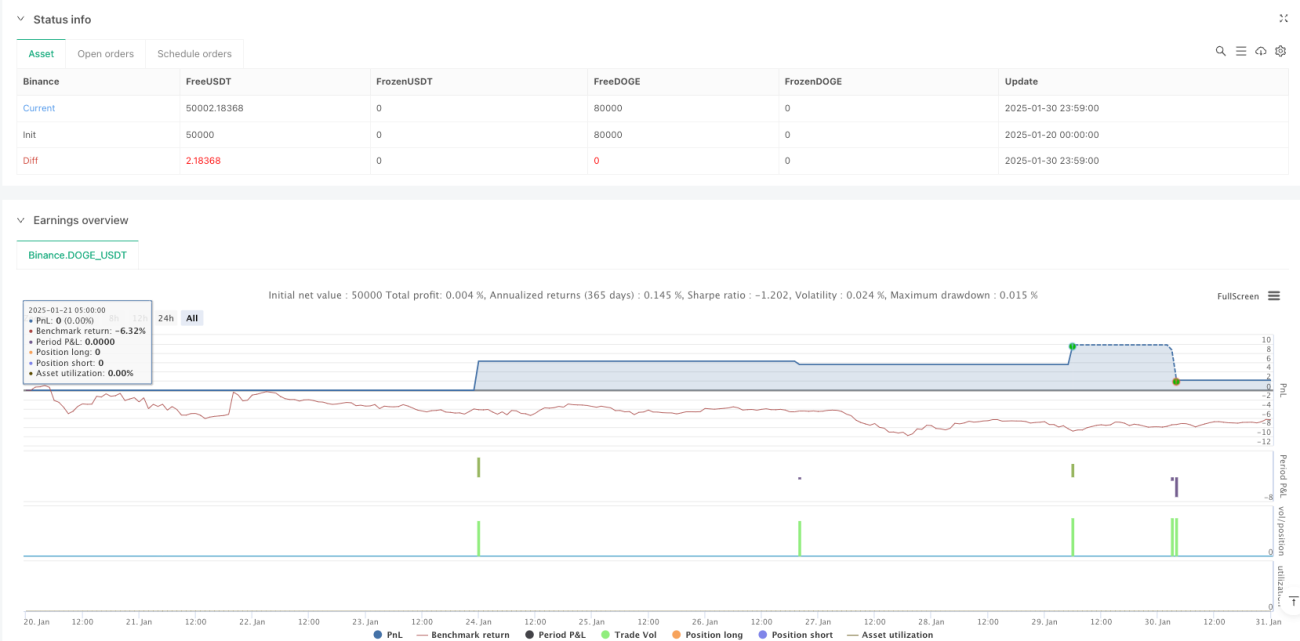
/*backtest
start: 2025-01-20 00:00:00
end: 2025-01-31 00:00:00
period: 1m
basePeriod: 1m
exchanges: [{"eid":"Binance","currency":"DOGE_USDT"}]
*/

//@version=5
strategy("Enhanced GBP/USD Strategy with ADX", overlay=true, default_qty_type=strategy.percent_of_equity, default_qty_value=1)

// === Input Parameters ===- 1