
Die Strategie ist ein Trend-Tracking-System, das mehrere technische Indikatoren kombiniert. Es basiert hauptsächlich auf den Kreuzsignalen von RSI, MACD und SMA, um die Handelsrichtung zu bestimmen, während die ATR-Indikatoren verwendet werden, um die Stop-Loss- und Profit-Levels dynamisch anzupassen. Die Strategie integriert auch einen Handelsvolumenfilter, um sicherzustellen, dass der Handel unter ausreichender Marktliquidität stattfindet, und verwendet teilweise Stoppmechanismen zur Optimierung der Kapitalverwaltung.
Die Strategie nutzt eine Dreifach-Verifizierung, um die Transaktionssignale zu bestätigen:
Die Multiple Verification dient der Verringerung von Falschsignalen und der Erhöhung der Handelsgenauigkeit. Die Strategie erfolgt, wenn mehrere Bedingungen erfüllt werden: (trend up + RSI, 40+ MACD up + Transaktionsmengenbestätigung) Positionen eröffnet werden, wobei ATR zweimal als Stop-Loss und viermal als Stop-Out verwendet wird.
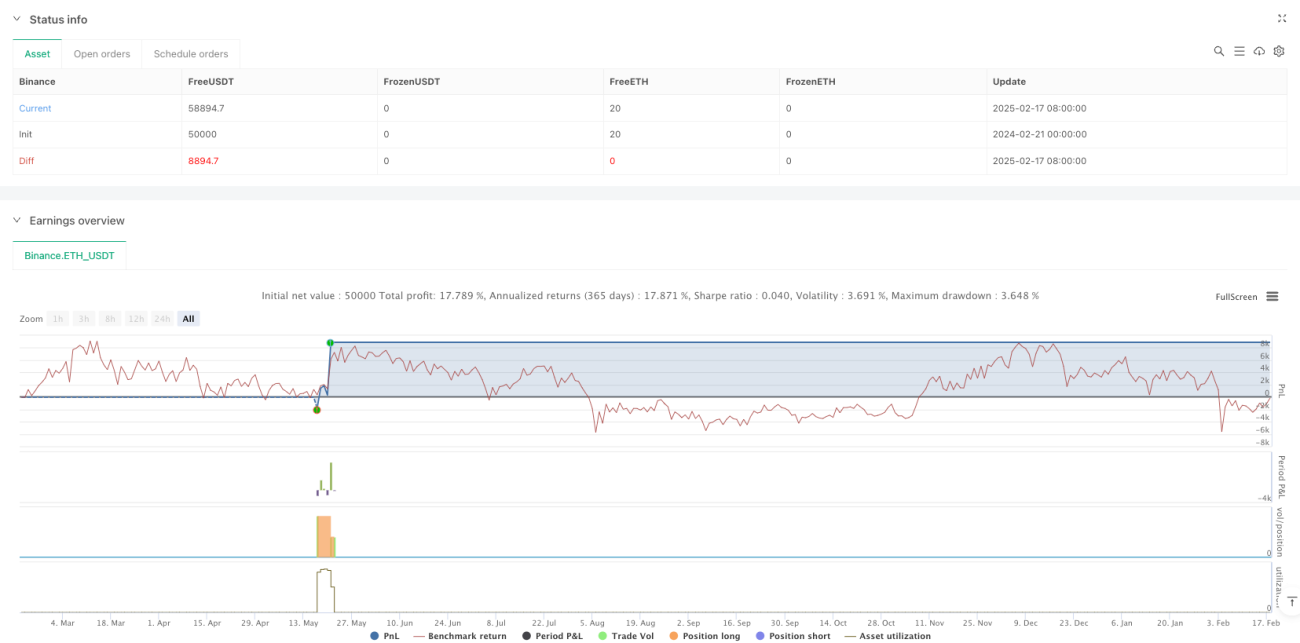
Es handelt sich um eine umfassende Trend-Tracking-Strategie, die durch die kombinierte Verwendung von mehreren technischen Indikatoren ein robustes Handelssystem aufbaut. Die Hauptmerkmale der Strategie sind die Anpassung an Marktveränderungen durch dynamische Stop-Loss- und Profit-Mechanismen, während die Sicherheit gewährleistet wird. Obwohl es einige Optimierungsmöglichkeiten gibt, ist der Gesamtrahmen vernünftig und eignet sich für weitere Verbesserungen und Tests in der Praxis.
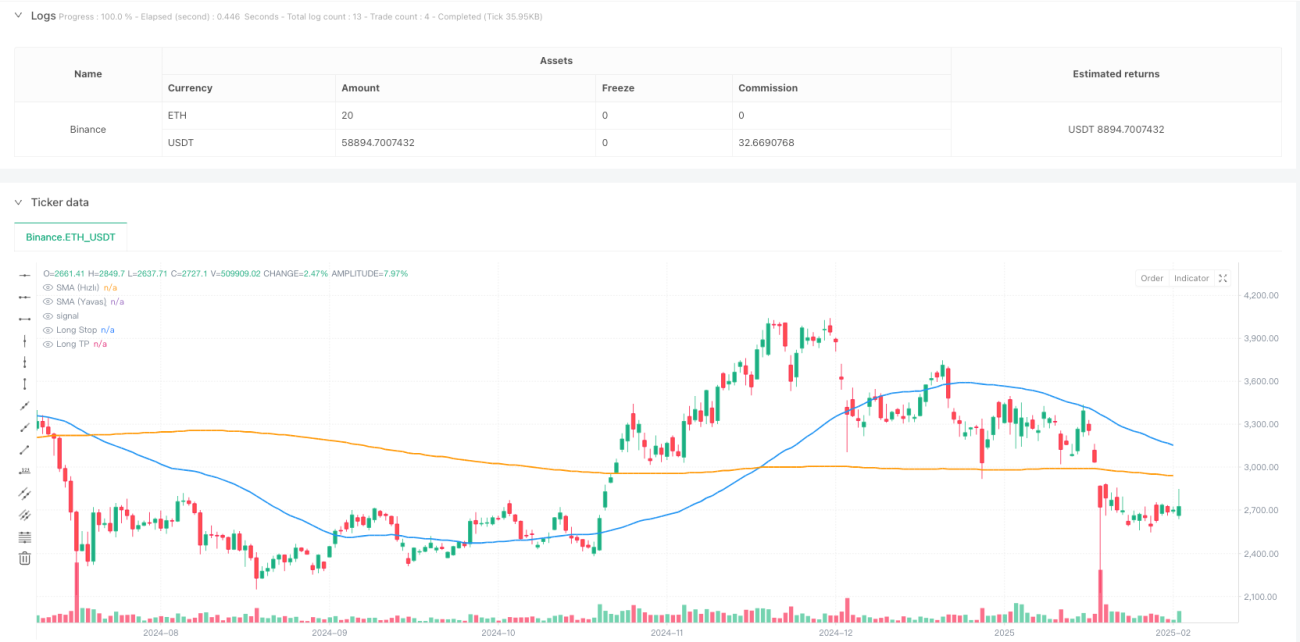
/*backtest
start: 2024-02-21 00:00:00
end: 2025-02-18 08:00:00
period: 1d
basePeriod: 1d
exchanges: [{"eid":"Binance","currency":"ETH_USDT"}]
*/
//@version=5
strategy( title="AI Trade Strategy v2 (Extended) - Fixed", shorttitle="AI_Trade_v2", overlay=true, format=format.price, initial_capital=100000, default_qty_type=strategy.percent_of_equity, default_qty_value=100, pyramiding=0)
//============================================================================
//=== 1) Basic Indicators (SMA, RSI, MACD) ==================================
//============================================================================
// Time Filter (optional, you can update)
inDateRange = (time >= timestamp("2018-01-01T00:00:00")) and (time <= timestamp("2069-01-01T00:00:00"))
// RSI Parameters
rsiLength = input.int(14, "RSI Period")
rsiOB = input.int(60, "RSI Overbought Level")
rsiOS = input.int(40, "RSI Oversold Level")
rsiSignal = ta.rsi(close, rsiLength)
// SMA Parameters
smaFastLen = input.int(50, "SMA Fast Period")
smaSlowLen = input.int(200, "SMA Slow Period")
smaFast = ta.sma(close, smaFastLen)
smaSlow = ta.sma(close, smaSlowLen)
// MACD Parameters
fastLength = input.int(12, "MACD Fast Period")
slowLength = input.int(26, "MACD Slow Period")
signalLength = input.int(9, "MACD Signal Period")
[macdLine, signalLine, histLine] = ta.macd(close, fastLength, slowLength, signalLength)
//============================================================================
//=== 2) Additional Filter (Volume) ========================================
//============================================================================
useVolumeFilter = input.bool(true, "Use Volume Filter?")
volumeMaPeriod = input.int(20, "Volume MA Period")
volumeMa = ta.sma(volume, volumeMaPeriod)
// If volume filter is enabled, current bar volume should be greater than x times the average volume
volMultiplier = input.float(1.0, "Volume Multiplier (Volume > x * MA)")
volumeFilter = not useVolumeFilter or (volume > volumeMa * volMultiplier)
//============================================================================
//=== 3) Trend Conditions (SMA) ============================================
//============================================================================
isBullTrend = smaFast > smaSlow
isBearTrend = smaFast < smaSlow
//============================================================================
//=== 4) Entry Conditions (RSI + MACD + Trend + Volume) ====================
//============================================================================
// RSI crossing above 30 + Bullish Trend + Positive MACD + Volume Filter
longCondition = isBullTrend and ta.crossover(rsiSignal, rsiOS) and (macdLine > signalLine) and volumeFilter
shortCondition = isBearTrend and ta.crossunder(rsiSignal, rsiOB) and (macdLine < signalLine) and volumeFilter
//============================================================================
//=== 5) ATR-based Stop + Trailing Stop ===================================
//============================================================================
atrPeriod = input.int(14, "ATR Period")
atrMultiplierSL = input.float(2.0, "Stop Loss ATR Multiplier")
atrMultiplierTP = input.float(4.0, "Take Profit ATR Multiplier")
atrValue = ta.atr(atrPeriod)
//============================================================================
//=== 6) Trade (Position) Management ======================================
//============================================================================
if inDateRange
//--- Long Entry ---
if longCondition
strategy.entry(id="Long", direction=strategy.long, comment="Long Entry")
//--- Short Entry ---
if shortCondition
strategy.entry(id="Short", direction=strategy.short, comment="Short Entry")
//--- Stop & TP for Long Position ---
if strategy.position_size > 0
// ATR-based fixed Stop & TP calculation
longStopPrice = strategy.position_avg_price - atrValue * atrMultiplierSL
longTakeProfit = strategy.position_avg_price + atrValue * atrMultiplierTP
// PARTIAL EXIT: (Example) take 50% of the position at early TP
partialTP = strategy.position_avg_price + (atrValue * 2.5)
strategy.exit( id = "Partial TP Long", stop = na, limit = partialTP, qty_percent= 50, from_entry = "Long" )
// Trailing Stop + Final ATR Stop
// WARNING: trail_offset=... is the offset in price units.
// For example, in BTCUSDT, a value like 300 means a 300 USDT trailing distance.
float trailingDist = atrValue * 1.5
strategy.exit( id = "Long Exit (Trail)", stop = longStopPrice, limit = longTakeProfit, from_entry = "Long", trail_offset= trailingDist )
//--- Stop & TP for Short Position ---
if strategy.position_size < 0
// ATR-based fixed Stop & TP calculation for Short
shortStopPrice = strategy.position_avg_price + atrValue * atrMultiplierSL
shortTakeProfit = strategy.position_avg_price - atrValue * atrMultiplierTP
// PARTIAL EXIT: (Example) take 50% of the position at early TP
partialTPShort = strategy.position_avg_price - (atrValue * 2.5)
strategy.exit( id = "Partial TP Short", stop = na, limit = partialTPShort, qty_percent= 50, from_entry = "Short" )
// Trailing Stop + Final ATR Stop for Short
float trailingDistShort = atrValue * 1.5
strategy.exit( id = "Short Exit (Trail)", stop = shortStopPrice, limit = shortTakeProfit, from_entry = "Short", trail_offset= trailingDistShort )
//============================================================================
//=== 7) Plot on Chart (SMA, etc.) =========================================
//============================================================================
plot(smaFast, color=color.blue, linewidth=2, title="SMA (Fast)")
plot(smaSlow, color=color.orange, linewidth=2, title="SMA (Slow)")
// (Optional) Plot Stop & TP levels dynamically:
longStopForPlot = strategy.position_size > 0 ? strategy.position_avg_price - atrValue * atrMultiplierSL : na
longTPForPlot = strategy.position_size > 0 ? strategy.position_avg_price + atrValue * atrMultiplierTP : na
shortStopForPlot = strategy.position_size < 0 ? strategy.position_avg_price + atrValue * atrMultiplierSL : na
shortTPForPlot = strategy.position_size < 0 ? strategy.position_avg_price - atrValue * atrMultiplierTP : na
plot(longStopForPlot, color=color.red, style=plot.style_linebr, title="Long Stop")
plot(longTPForPlot, color=color.green, style=plot.style_linebr, title="Long TP")
plot(shortStopForPlot, color=color.red, style=plot.style_linebr, title="Short Stop")
plot(shortTPForPlot, color=color.green, style=plot.style_linebr, title="Short TP")