Multi-Indikator-Cross-Trend-Tracking-Strategie kombiniert mit Fibonacci-Retracement und Stop-Profit- und Stop-Loss-Optimierungssystem

Überblick
Die Strategie ist ein integriertes Handelssystem, das die Index-Moving Average (EMA) -Kreuzung, die Fibonacci-Rückschlag-Ebene, die Trendentscheidung und den Stop-Loss-Mechanismus kombiniert. Die Strategie bestimmt die Handelssignale durch die Kreuzung der 9- und 21-Zyklus-EMA, während die Fibonacci-Rückschlag-Ebene kombiniert wird, um den Einstieg zu optimieren und die Handelsgenauigkeit durch die Überwachung des Trends in Echtzeit zu verbessern. Das System integriert auch einen Prozentstop-Loss-Mechanismus, um das Risiko effektiv zu kontrollieren.
Strategieprinzip
Die Kernlogik der Strategie basiert auf den folgenden Schlüsselelementen:
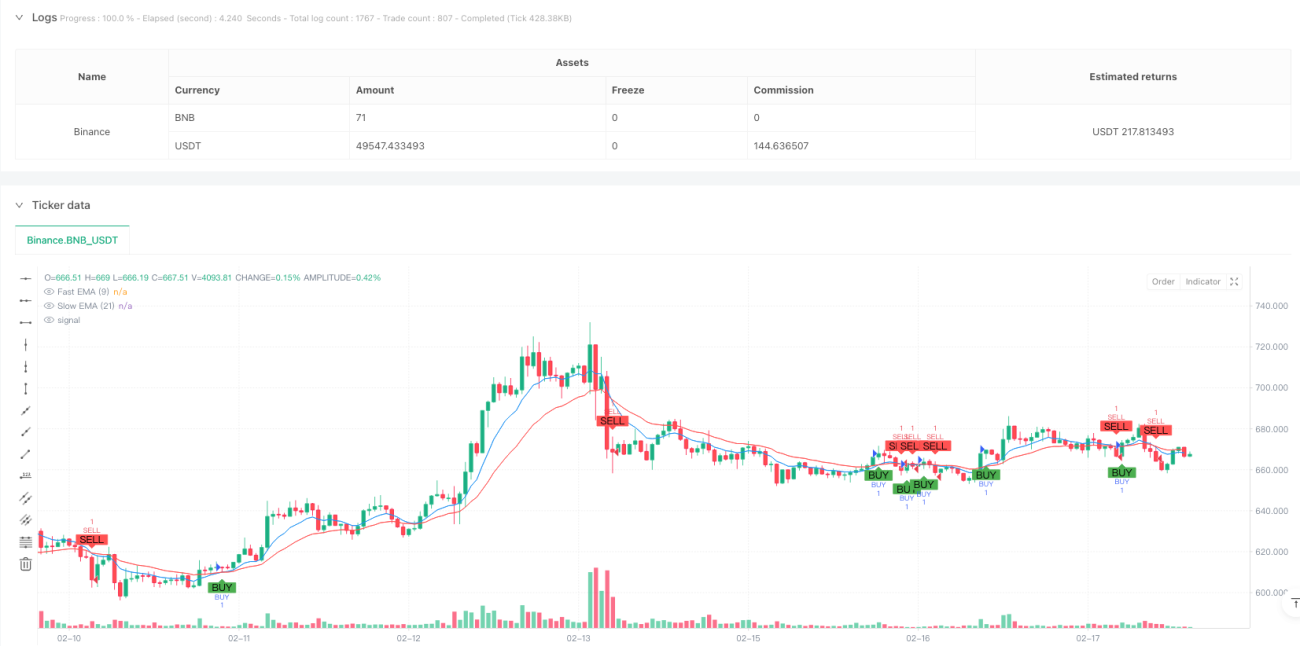
- Das System erzeugt ein Mehrfachsignal, wenn ein schnelles EMA ((9 Zyklen) aufwärts durch ein langsames EMA ((21 Zyklen) geht.
- Wenn ein schneller EMA nach unten durch einen langsamen EMA fährt, erzeugt das System ein Leerstandssignal
- Die Fibonacci-Rückgangsebenen von 23,6%, 38,2%, 50% und 61,8% werden durch Berechnung von Höchst- und Tiefstpreisen für 100 Zyklen ermittelt
- Beurteilung des aktuellen Trendstatus durch die Position des Schlusskurses in Bezug auf die schnelle EMA
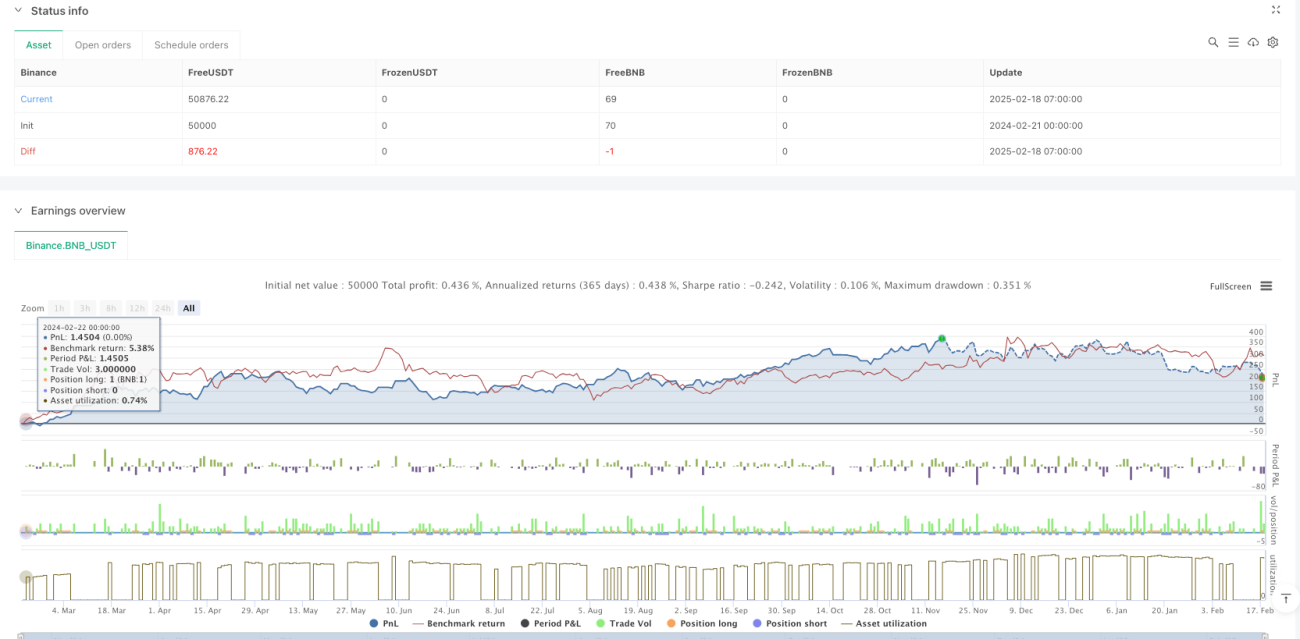
- Bei der Ausführung des Handels setzt das System automatisch einen Stop-Loss mit einem festen Prozentsatz von 4%) und einen Stop-Loss von 2%) ein.
Strategische Vorteile
- Multidimensionelle Signalbestätigung: Kombination von EMA-Kreuzungen, Fibonacci-Levels und Trend-Status, um zuverlässigere Handelssignale zu liefern
- Perfekte Risikomanagement: Automatische Risikokontrolle mit vorgegebenen Stop-Loss-Prozentsätzen
- Trendverfolgung: EMA-Kreuz-Kombinations-Trend-Bewertung, die die Markttrends effektiv erfasst
- Klare visuelle Rückmeldung: Handelsentscheidungen werden erleichtert, indem die Tags die wichtigsten Preisniveaus, Trends und Handelssignale zeigen
- Hohe Systematisation: Die Logik des Handels ist klar und die Beeinträchtigung durch subjektive Urteile wird verringert
Strategisches Risiko
- Oszillationsrisiken: Häufige EMA-Kreuzungen können zu falschen Signalen führen
- Rückstandsrisiko: Der Moving Average ist im Wesentlichen ein Rückstandsindikator, der möglicherweise die beste Einstiegsmomente verpasst
- Fixed Stop-Loss-Risiko: Ein vorgegebener Fixed-Percentage-Stop-Loss ist möglicherweise nicht für alle Marktbedingungen geeignet
- Risiken von Signalkonflikten: Es können widersprüchliche Signale zwischen mehreren Indikatoren auftreten, was die Entscheidungsfindung erschwert
- Marktschwankungen: starke Schwankungen können zu unzumutbaren Stop-Loss-Punkten führen
Richtung der Strategieoptimierung
- Dynamische Stop-Loss-Optimierung: Die Stop-Loss-Distanz kann dynamisch an die ATR oder die Marktfluktuation angepasst werden
- Signalfilterung: Erhöhung von Hilfsindikatoren wie Verkehrsvolumen, Antrieb und so weiter, um falsche Signale zu filtern
- Anpassung der Parameter: Einführung eines Anpassungsmechanismus, der die EMA-Zyklen dynamisch an die Marktlage anpasst
- Einstiegsoptimierung: Einstiegsoptimierung in der Nähe des Fibonacci-Niveaus, kombiniert mit Preisgestaltung und Umsatz
- Positionsverwaltung: Dynamische Positionsverwaltungssysteme, die auf Volatilität und Konto-Risiko basieren
Zusammenfassen
Die Strategie baut durch die Integration mehrerer klassischer technischer Analyse-Tools ein relativ vollständiges Handelssystem auf. Ihr Vorteil liegt in der Multidimensionalität der Signalbestätigung und der Systematisierung der Risikomanagement, aber immer noch Optimierung für verschiedene Marktumgebungen. Der Händler wird empfohlen, die Parameter in Verbindung mit den spezifischen Marktbedingungen in der Praxis zu optimieren und immer auf die Risiken zu achten.
- 1