Dynamische Trendhandelsstrategie basierend auf mehreren Zeiträumen Hurst-Exponent und Fibonacci-Retracement

HURST FIBONACCI RSI MTF RR SL TP ATR
Erstellungsdatum: 2025-02-20 16:59:37 zuletzt geändert: 2025-02-20 16:59:37
Kopie: 2 Klicks: 393
2
konzentrieren Sie sich auf
319
Anhänger

Dynamische Trendhandelsstrategie basierend auf mehreren Zeiträumen Hurst-Exponent und Fibonacci-Retracement Dynamische Trendhandelsstrategie basierend auf mehreren Zeiträumen Hurst-Exponent und Fibonacci-Retracement

Überblick

Es handelt sich um eine innovative, mehrzeitige Handelsstrategie, die den Hurst-Exponent und die Fibonacci-Rückgangshöhe kombiniert. Die Strategie bewertet die Merkmale des Markttrends durch die Berechnung des Hurst-Index für verschiedene Zeiträume und identifiziert potenzielle Handelsmöglichkeiten in Verbindung mit den Fibonacci-Kritischen. Die Strategie verwendet ein strenges Risikomanagement-Framework, das eine feste Risikoprozentualität, ein Zielgewinn-Verlust-Verhältnis und Grenzen für die tägliche und gesamte Handelsfrequenz umfasst.

Strategieprinzip

Die Kernlogik der Strategie basiert auf zwei Hauptkomponenten:

  1. Der Herst-Index wird für den aktuellen und höheren Zeitabschnitt berechnet. Ein Herst-Index von mehr als 0,5 zeigt, dass der Markt eine kontinuierliche Tendenz aufweist, und ein Herst-Index von weniger als 0,5 zeigt, dass der Markt möglicherweise eine mittlere Regression aufweist.
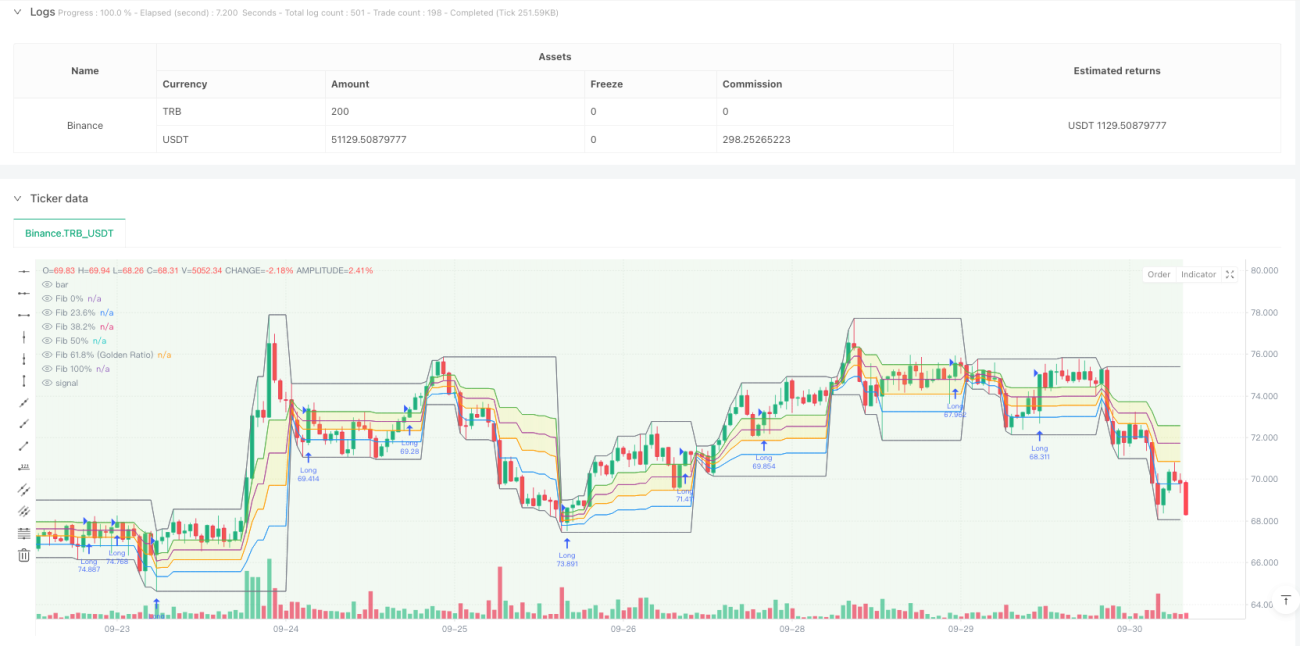
  2. Mit Hilfe der Fibonacci-Rücktrittswerte, die für die Berechnung der täglichen Höhen und Tiefen entscheidend sind, konzentrieren Sie sich auf die beiden Ebenen 61.8% (Golddivision) und 38.2%. Wenn der Tagelinie-Herst-Index größer als 0.5 ist und der Preis die 61.8%-Ebene überschreitet, wird ein Mehrsignal ausgelöst. Wenn der Tagelinie-Herst-Index kleiner als 0.5 ist und der Preis die 38.2%-Ebene überschreitet, wird ein Leersignal ausgelöst.

Strategische Vorteile

  1. Multidimensionelle Analyse: Bietet eine umfassendere Sicht auf den Markt durch die Kombination von Trendanalysen und Preisniveaus für verschiedene Zeiträume
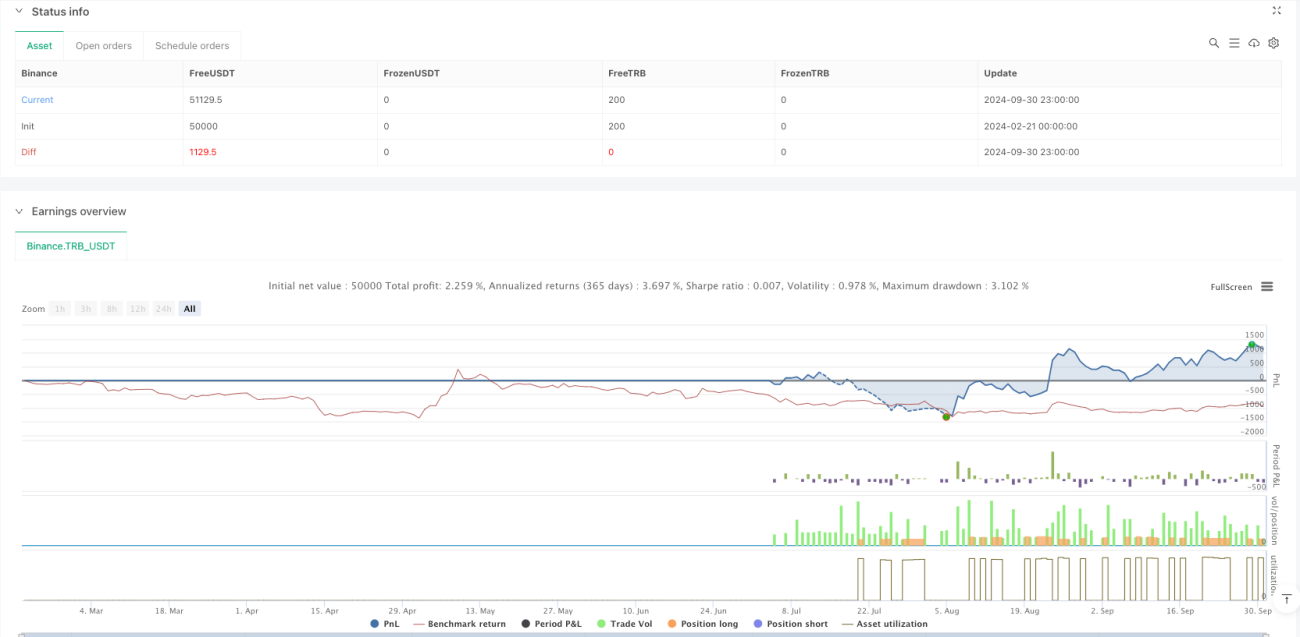
  2. Gute Risikomanagement: Risikomanagement-Framework mit einem festen Risikoprozentsatz (%) und einem Zielgewinn-Verlust-Verhältnis (%)
  3. Frequenzkontrolle: Setzen Sie eine maximale Anzahl von Transaktionen pro Tag und eine Gesamtgrenze für die Anzahl der Transaktionen, um Übertriebenheit zu vermeiden
  4. Visualisierungshilfe: Tabellen mit Hintergrundfarbänderungen und Informationen zu wichtigen Kennzahlen, die Echtzeit-Markttrends liefern

Strategisches Risiko

  1. Marktumgebungsabhängigkeit: In untrendenden OTC-Märkten kann es schlechter laufen
  2. Parameter-Sensitivität: Die Wahl der Berechnungsphase des Herst-Index und der Fibonacci-Zeitphase beeinflusst die Strategie.
  3. Einfluss von Ausrutschen: Unter schlechten Marktbedingungen kann ein höheres Ausrutschrisiko auftreten
  4. Systemische Komplexität: Kombinationen mehrerer Komponenten erhöhen die Wahrscheinlichkeit, dass Strategien fehlschlagen

Richtung der Strategieoptimierung

  1. Dynamische Parameter-Anpassung: Die Berechnungszeit des Hurst-Index kann automatisch an die Marktfluktuation angepasst werden
  2. Erweiterte Filter: Einführung zusätzlicher Marktsituationsfilter, um die Signalqualität zu verbessern
  3. Optimierung der Positionsverwaltung: Dynamische Positionsverwaltung basierend auf Volatilität
  4. Verbesserte Ausspielungsmechanismen: Entwicklung flexiblerer Methoden zur Festlegung von Gewinnzielen

Zusammenfassen

Es handelt sich um eine innovative Strategie, die klassische Instrumente der Technischen Analyse mit modernen quantitativen Methoden kombiniert. Die Strategie konzentriert sich auf die praktische Durchführbarkeit, während sie die theoretische Grundlage beibehält, durch mehrere Zeitzyklen und strenge Risikomanagement. Obwohl ein gewisser Optimierungsraum besteht, bietet das Gesamtrahmen eine gute Erweiterbarkeit und einen praktischen Wert.

Strategiequellcode
/*backtest
start: 2024-02-21 00:00:00
end: 2024-10-01 00:00:00
period: 1h
basePeriod: 1h
exchanges: [{"eid":"Binance","currency":"TRB_USDT"}]
*/

//@version=5
// Advanced Multi-Timeframe Trading System (Risk Managed)
// 
// Description:
// This strategy combines an approximate measure of market trending via a Hurst exponent
// calculation with Fibonacci retracement levels derived from a higher timeframe (default: Daily)
// to identify potential reversal zones and trade opportunities. The Hurst exponent is calculated
// as a rough indicator of market persistence, while the Fibonacci retracement levels provide potential
// support and resistance areas.
// 
// Signal Logic:
// - A long entry is signaled when the price crosses above the 61.8% Fibonacci level (Golden Ratio)
//   and the daily Hurst exponent is above 0.5 (suggesting a trending market).
// - A short entry is signaled when the price crosses below the 38.2% Fibonacci level and the daily Hurst
//   exponent is below 0.5.
// 
// Risk Management:
// Each trade is risk-managed with a stop-loss set at 2% below (or above for shorts) the entry price,
// and a take profit order is set to achieve a 1:2 risk-reward ratio. Position sizing is fixed at 10% of
// equity per trade. Additionally, the strategy limits trading to a maximum of 5 trades per day and 510 trades
// overall (for backtesting since 2019) to ensure a realistic number of orders.
// 
// Backtesting Parameters:
// - Initial Capital: $10,000
// - Commission: 0.1% per trade
// - Slippage: 1 tick per bar
// - Position Sizing: 10% of equity per trade
// 
// Disclaimer:
// Past performance is not indicative of future results. This strategy is experimental and is provided solely
// for educational purposes. Use caution and perform your own testing before any live deployment.
// 
// Author: [Your Name]
// Date: [Date]

strategy("Advanced Multi-Timeframe Trading System (Risk Managed)",
     overlay=true, 
     max_bars_back=500, 
     initial_capital=10000, 
     default_qty_type=strategy.percent_of_equity, 
     default_qty_value=10,          // 10% of equity per trade
     commission_type=strategy.commission.percent, 
     commission_value=0.1,          // 0.1% commission per trade
     slippage=1,                    // 1 tick per bar
     calc_on_order_fills=true, 
     calc_on_every_tick=true)

// ─── INPUTS ─────────────────────────────────────────────────────────────
hurstLen        = input.int(50, title="Hurst Lookback Period", minval=10)
fibTF           = input.timeframe("D", title="Fibonacci Retracement Timeframe")
maxTradesPerDay = input.int(5, title="Max Trades Per Day", minval=1)
maxTotalTrades  = input.int(510, title="Max Total Trades since 2019", minval=1)
riskPerc        = input.float(2.0, title="Risk Percent per Trade (%)", step=0.1) * 0.01  // 2% risk per trade
rrRatio         = input.float(2.0, title="Risk-Reward Ratio", step=0.1)                 // Target profit = 2x risk

// ─── FUNCTION: Approximate Hurst Exponent Calculation ──────────────────────
// This function uses a simple rescaled range method to approximate the Hurst exponent.
// Note: This is an experimental calculation and should be interpreted as a rough gauge of market trending.
calcHurst(src, len) =>
    mean   = ta.sma(src, len)
    dev    = src - mean
    cumDev = 0.0
    for i = 0 to len - 1
        cumDev := cumDev + dev[i]
    R     = ta.highest(cumDev, len) - ta.lowest(cumDev, len)
    S     = ta.stdev(src, len)
    hurst = na(S) or S == 0 ? na : math.log(R / S) / math.log(len)
    hurst

// Calculate the Hurst exponent on the current timeframe and from a higher timeframe (daily)
currHurst  = calcHurst(close, hurstLen)
dailyHurst = request.security(syminfo.tickerid, "D", calcHurst(close, hurstLen))

// ─── FIBONACCI RETRACEMENT LEVELS (WITH GOLDEN RATIO) ──────────────────────────
// Retrieve the daily high/low from the selected timeframe (default: Daily)
dHigh   = request.security(syminfo.tickerid, fibTF, high)
dLow    = request.security(syminfo.tickerid, fibTF, low)

// Define Fibonacci levels between the daily low and high.
fib_0   = dLow
fib_100 = dHigh
fib_236 = dLow + 0.236 * (dHigh - dLow)
fib_382 = dLow + 0.382 * (dHigh - dLow)
fib_500 = dLow + 0.5   * (dHigh - dLow)
fib_618 = dLow + 0.618 * (dHigh - dLow)  // Golden ratio level

// Plot the Fibonacci levels for reference.
pFib0   = plot(fib_0,   color=color.gray,   title="Fib 0%")
pFib236 = plot(fib_236, color=color.blue,   title="Fib 23.6%")
pFib382 = plot(fib_382, color=color.orange, title="Fib 38.2%")
pFib500 = plot(fib_500, color=color.purple, title="Fib 50%")
pFib618 = plot(fib_618, color=color.green,  title="Fib 61.8% (Golden Ratio)")
pFib100 = plot(fib_100, color=color.gray,   title="Fib 100%")
// Fill the area between the 61.8% and 38.2% levels to highlight the key retracement zone.
fill(pFib618, pFib382, color=color.new(color.yellow, 80), title="Fibonacci Retracement Zone")

// ─── TRADE COUNT MANAGEMENT ─────────────────────────────────────────────────
// To simulate realistic trading frequency, the strategy limits trades to a maximum of 5 per day and 510 overall.
var int tradesToday     = 0
var int globalTradeCount = 0

// Reset the daily trade counter at the start of a new day.
newDay = ta.change(time("D"))
if newDay
    tradesToday := 0

// Allow new trades only if within the daily and overall trade limits.
canTrade = (tradesToday < maxTradesPerDay) and (globalTradeCount < maxTotalTrades)

// ─── TRADING SIGNALS ─────────────────────────────────────────────────────────
// Entry conditions based on Fibonacci levels and daily Hurst conditions:
// • Long: Price crosses above the 61.8% (Golden Ratio) level and daily Hurst > 0.5.
// • Short: Price crosses below the 38.2% level and daily Hurst < 0.5.
longCond  = ta.crossover(close, fib_618) and (dailyHurst > 0.5)
shortCond = ta.crossunder(close, fib_382) and (dailyHurst < 0.5)

if longCond and canTrade
    strategy.entry("Long", strategy.long)
    tradesToday      := tradesToday + 1
    globalTradeCount := globalTradeCount + 1

if shortCond and canTrade
    strategy.entry("Short", strategy.short)
    tradesToday      := tradesToday + 1
    globalTradeCount := globalTradeCount + 1

// ─── RISK MANAGEMENT: STOP-LOSS & TAKE-PROFIT ──────────────────────────────
// For active positions, define stop-loss and take profit levels based on the entry price.
// This ensures that each trade risks approximately 2% of the entry price with a target
// of 2x the risk (1:2 risk-reward ratio).
if strategy.position_size > 0
    longStop   = strategy.position_avg_price * (1 - riskPerc)
    longTarget = strategy.position_avg_price * (1 + rrRatio * riskPerc)
    strategy.exit("Long Exit", from_entry="Long", stop=longStop, limit=longTarget)
if strategy.position_size < 0
    shortStop   = strategy.position_avg_price * (1 + riskPerc)
    shortTarget = strategy.position_avg_price * (1 - rrRatio * riskPerc)
    strategy.exit("Short Exit", from_entry="Short", stop=shortStop, limit=shortTarget)

// ─── CHART OVERLAYS & VISUAL AIDS ────────────────────────────────────────────
// Background color indicates the daily market trend:
// Green for trending conditions (dailyHurst > 0.5) and red for less trending conditions.
bgcolor(dailyHurst > 0.5 ? color.new(color.green, 90) : color.new(color.red, 90), title="Daily Trend Background")

// Display an information table in the top-right corner to help interpret key values.
var table infoTable = table.new(position.top_right, 2, 4, border_width=1, frame_color=color.gray)
if barstate.islast
    table.cell(infoTable, 0, 0, "Current Hurst", text_color=color.white, bgcolor=color.black)
    table.cell(infoTable, 1, 0, str.tostring(currHurst, "#.###"), text_color=color.white, bgcolor=color.black)
    table.cell(infoTable, 0, 1, "Daily Hurst", text_color=color.white, bgcolor=color.black)
    table.cell(infoTable, 1, 1, str.tostring(dailyHurst, "#.###"), text_color=color.white, bgcolor=color.black)
    table.cell(infoTable, 0, 2, "Trades Today", text_color=color.white, bgcolor=color.black)
    table.cell(infoTable, 1, 2, str.tostring(tradesToday), text_color=color.white, bgcolor=color.black)
    table.cell(infoTable, 0, 3, "Global Trades", text_color=color.white, bgcolor=color.black)
    table.cell(infoTable, 1, 3, str.tostring(globalTradeCount), text_color=color.white, bgcolor=color.black)

// Optional: Add labels on the final bar to mark the key Fibonacci levels.
if barstate.islast
    label.new(bar_index, fib_618, "61.8% (Golden Ratio)", style=label.style_label_left, color=color.green, textcolor=color.white, size=size.tiny)
    label.new(bar_index, fib_382, "38.2%", style=label.style_label_left, color=color.orange, textcolor=color.white, size=size.tiny)