
Überblick
Die Strategie ist ein Handelssystem, das auf Preisbruch und dynamische Verfolgung von Stop-Loss basiert. Es wird gehandelt, indem die Höchst- und Tiefpreise der letzten N-Zyklen überwacht werden, um zu handeln, wenn die Preise diese kritischen Niveaus überschreiten. Die Strategie verwendet einen intelligenten Stop-Loss-Mechanismus, der die Verfolgung von Stop-Losses nur aktiviert, wenn ein Gewinn von 1% erreicht wird, so dass die Gewinne vollständig entwickelt werden können.
Strategieprinzip
Die Kernlogik der Strategie umfasst die folgenden Schlüsselelemente:
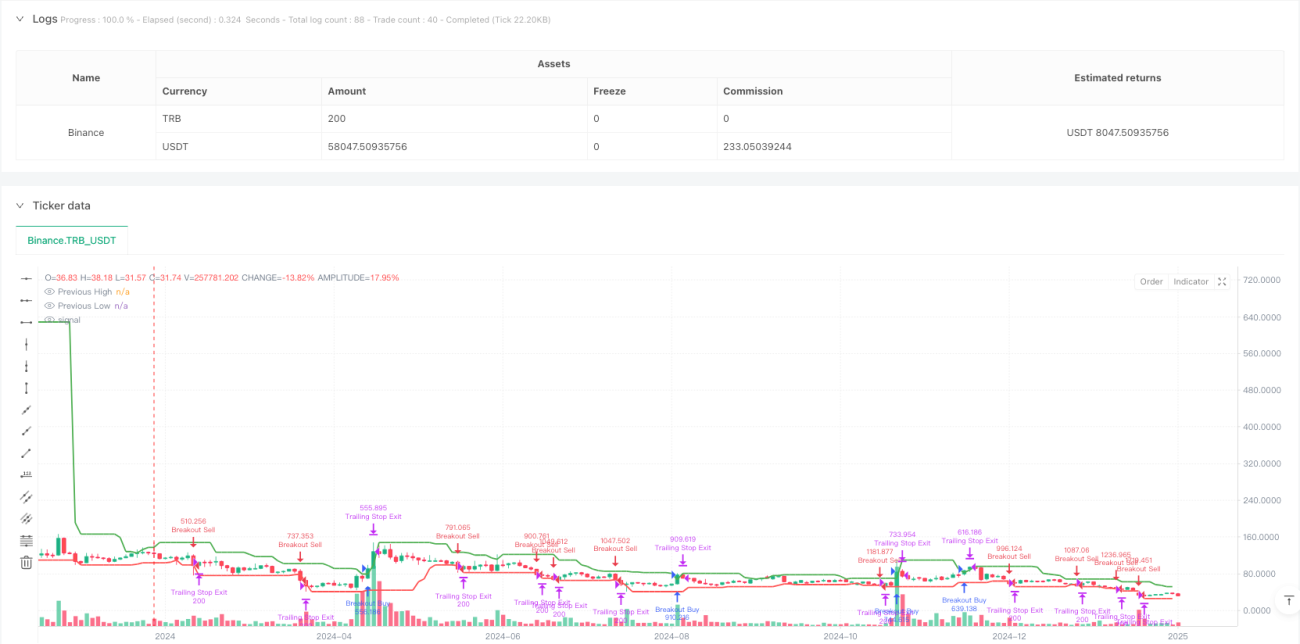
- Eintrittssignale: Durch die Berechnung der Höchst- und Tiefpreise der letzten N-Zyklen wird ein Handelssignal ausgelöst, wenn die aktuellen Preise diese überschreiten. Mehrköpfige Eintritte erfordern einen bestimmten Prozentsatz der Preise, um die vorherigen Höchststände zu überschreiten, während die Leerköpfe die vorherigen Tiefststände überschreiten müssen.
- Handelsabwicklung: Ein 1-stündiger Abkühlungszeitraum, um häufige Geschäfte bei starken Schwankungen zu vermeiden.
- Risikokontrolle: Durch den Einsatz eines dynamischen Stop-Loss-Trackers, der nur nach einem Gewinn von 1% aktiviert wird, kann der Gewinn besser geschützt werden.
- Parameteroptimierung: Schlüsselparameter wie die Rücklauf-Zyklus, Breakout-Trench, Stop-Loss-Prozentsatz und so weiter können an die verschiedenen Marktbedingungen angepasst werden.
Strategische Vorteile
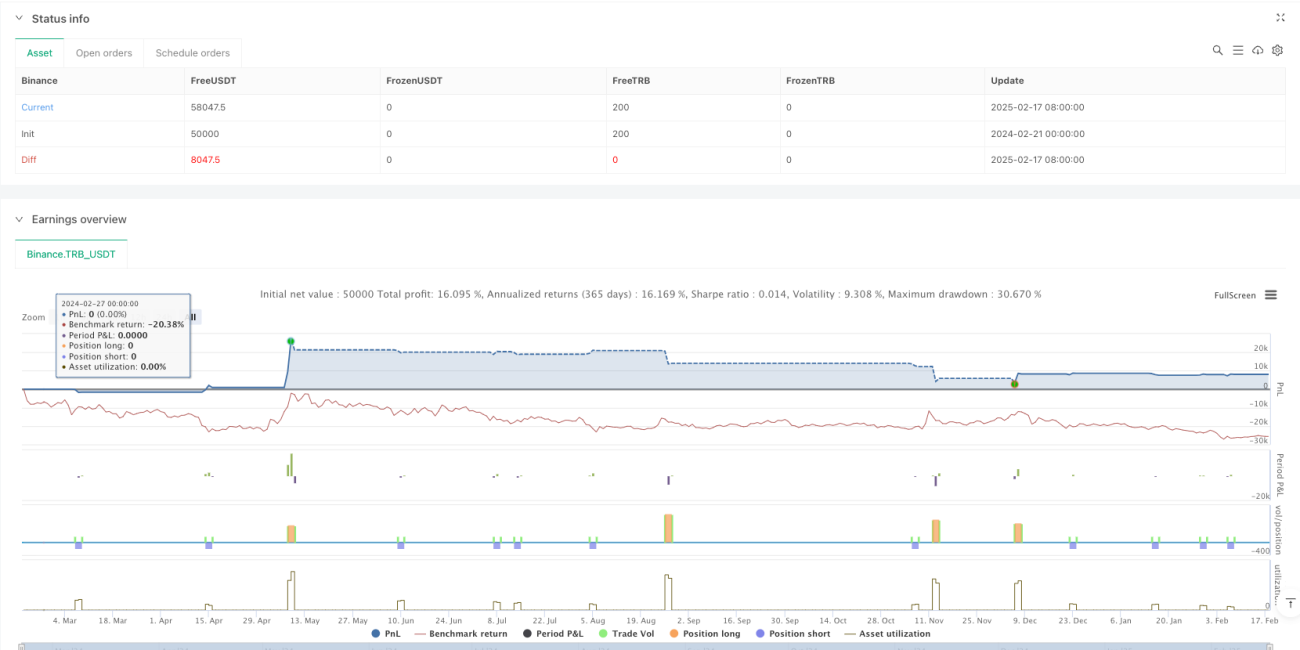
- Dynamisches Risikomanagement: Durch die Verfolgung von Stop-Loss-Mechanismen kann die Strategie die Gewinnspanne erhöhen, während sie gleichzeitig die Erträge schützt.
- Flexible Anpassungsfähigkeit: Strategien können sich an unterschiedliche Marktbedingungen anpassen, um die Performance durch Anpassung der Parameter zu optimieren.
- Filtermechanismen: Die Verwendung von Abkühlzeiten verhindert übermäßige Transaktionen und verbessert die Qualität der Transaktionen.
- Einfach und effektiv: Die Strategie ist klar, leicht zu verstehen und zu implementieren, aber gleichzeitig gut skalierbar.
Strategisches Risiko
- Gefahr eines Fehlbruchs: Es kann zu einem Fehlbruch kommen, der zu falschen Signalen führt. Es wird empfohlen, die Bestätigung der Transaktionen zu erhöhen.
- Schlupfpunkte: Während der hohen Schwankungen können größere Schlupfpunkte auftreten, die die Strategie beeinflussen.
- Parameter-Sensitivität: Die Strategie-Performance ist auf Parameter-Einstellungen empfindlich und erfordert eine sorgfältige Optimierung.
- Abhängigkeit vom Marktumfeld: In einem Umfeld mit geringer Volatilität kann es schlechter laufen.
Richtung der Strategieoptimierung
- Einführung von Durchschnittsindikatoren: Durch die Durchschnittsbestätigung wird die Zuverlässigkeit des Durchbruchs signalisiert.
- Trend-Filter hinzugefügt: Handelt nur in Richtung des Trends in Kombination mit einem langfristigen Trendindikator.
- Dynamische Parameter-Anpassung: Durchbruch- und Stop-Loss-Parameter werden automatisch an die Marktschwankungen angepasst.
- Mehrfache Zeitphase: Integration von Signalen aus mehreren Zeitphasen zur Verbesserung der Genauigkeit.
Zusammenfassen
Dies ist eine vernünftige Trend-Tracking-Strategie, die sowohl große Trends als auch effektive Risikokontrollen durch Preis-Breakouts und dynamische Stop-Losses ermöglicht. Die Strategie ist stark anpassbar und kann durch Parameteroptimierung an verschiedene Marktumgebungen angepasst werden. Es wird empfohlen, mit kleinen Positionen in der Realität zu beginnen und die Strategie unter verschiedenen Marktbedingungen schrittweise zu überprüfen.
- 1