
Überblick
Die Strategie ist ein selbstappierendes Handelssystem, das Trendverfolgung und Spaltenhandel kombiniert. Das System identifiziert dynamische Marktsituationen über ADX-Indikatoren und verwendet verschiedene Handelsstrategien in Trendmärkten und Schaukelmärkten. In Trendmärkten verwendet die Strategie ein Moving Average Crossover Signal in Verbindung mit RSI und MACD-Bestätigung.
Strategieprinzip
Der Kern der Strategie ist die Identifizierung des Marktzustands. Die Trend-Tracking-Strategie wird aktiviert, wenn der ADX größer als 25 ist und als Trendmarkt bezeichnet wird:
- Mehrköpfige Bedingung: 50 Tage Durchschnittslinie über 200 Tage Durchschnittslinie, während der RSI größer als 50 ist und die MACD-Linie über der Signallinie liegt
- Leerköpfe: 50 Tage unterhalb der 200-Tage-Mittellinie, während der RSI kleiner als 50 ist und die MACD-Linie unterhalb der Signallinie liegt
Wenn der ADX kleiner als 25 ist, wird der Markt als beunruhigt beurteilt und eine Zwischenhandelsstrategie aktiviert:
- Mehrköpfige Bedingung: Der Preis steigt über die Bollinger Bands und der RSI ist kleiner als 40
- Leerköpfe: Preise unterhalb der Bollinger Bands und RSI größer als 60
Die Stop-Loss-Stopp-Einstellung verwendet die dynamische Multiplikation des ATR, mit einem Stop-Loss von 1,5 mal ATR und einem Stop-Loss von 3 mal ATR.
Strategische Vorteile
- Marktanpassungsfähigkeit: Fähigkeit, automatisch zwischen Handelsstrategien zu wechseln, je nach Marktlage
- Multiple Signal Confirmation: Verringerung von Falschsignalen durch Kombination mehrerer Technikindikatoren
- Risikokontrolle verbessert: Dynamische Stop-Loss-Stopp-Mechanismen, um auf Marktschwankungen zu reagieren
- Klarheit der Strategie-Logik: Trends und Spannungsbereiche sind klar definiert, um eine optimale Anpassung zu ermöglichen
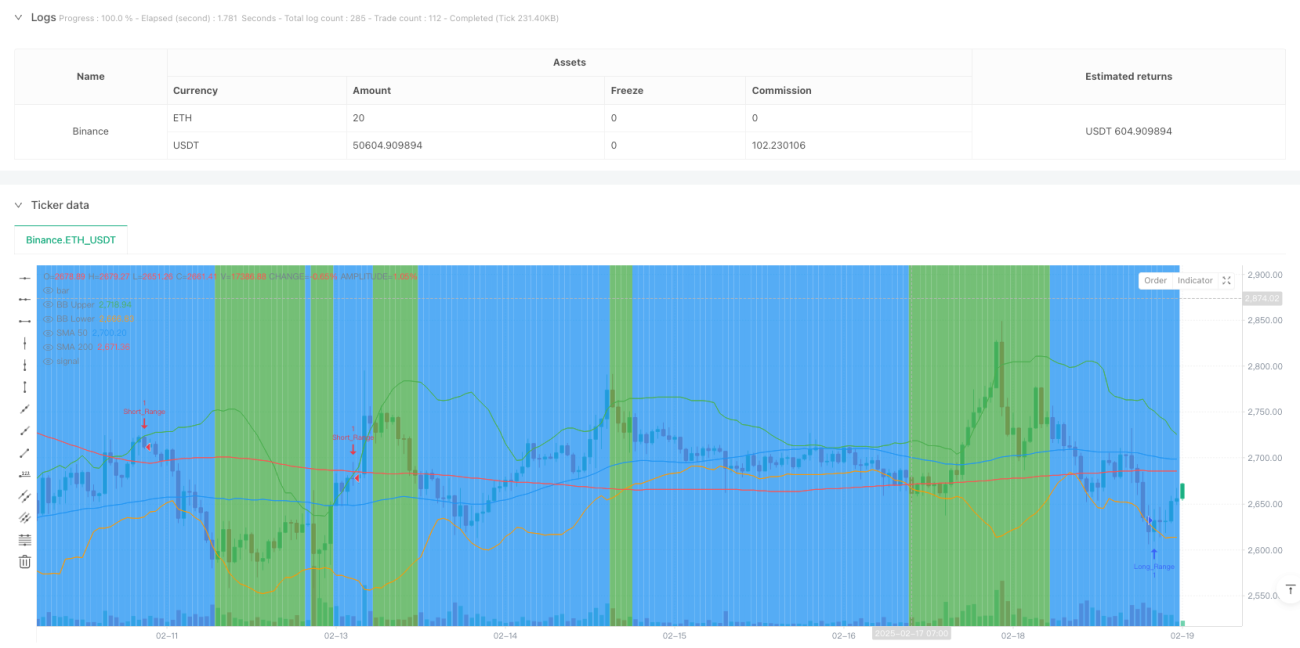
- Die visuelle Wirkung ist gut: die Hintergrundfarbe unterscheidet den Marktstatus, was intuitiv ist.
Strategisches Risiko
- Signalverzögerung: Indikatoren wie der Moving Average haben eine gewisse Verzögerung und können den besten Einstiegspunkt verpassen
- Falsche Durchbruchrisiken: Brin könnte falsche Durchbruchsignale in den schwachen Märkten geben
- Parameter-Sensitivität: Parameter-Einstellungen wie ADX-Thresholds und ATR-Multiplikatoren beeinflussen die Strategie-Performance
- Marktwechselrisiken: Falsche Signale in der Übergangsphase zwischen Trend und Schwankungen
- Stop-Limit-Risiko: ATR-Stopps mit festen Multiplikatoren können in Zeiten hoher Volatilität zu groß sein
Richtung der Strategieoptimierung
- Einführung von Traffic Analysis: Ein Traffic-Faktor in die Signalbestätigung, um die Signalsicherheit zu erhöhen
- Optimierung der Marktsituation: Erwägen Sie die Umstellung des ADX auf dynamische Abwertungen oder in Kombination mit anderen Indikatoren
- Verbesserung der Stop-Loss-Mechanismen: Einführung von Tracking-Stops oder dynamische Anpassung der ATR-Multiplikatoren an die Volatilität
- Erhöhung der Zeitfilterung: Hinzufügung von Zeitbeschränkungen für den Handel und Vermeidung von Perioden mit geringer Liquidität
- Verbesserte Signalbestätigungsmechanismen: Einbeziehung von Preismodell-Analysen zur Verbesserung der Signalqualität
Zusammenfassen
Die Strategie ist durch die dynamische Identifizierung von Marktzuständen und entsprechende Strategiewechsel an unterschiedliche Marktumgebungen angepasst. Durch die Kombination von mehreren technischen Indikatoren und dynamischen Risikokontrollmechanismen hat die Strategie eine gute Praktikabilität. Allerdings ist auf Risiken wie Signalverzögerung und falsche Durchbrüche zu achten. Es wird empfohlen, in der Praxis ausreichend zu testen und die Parameter zu optimieren.
- 1