
Überblick
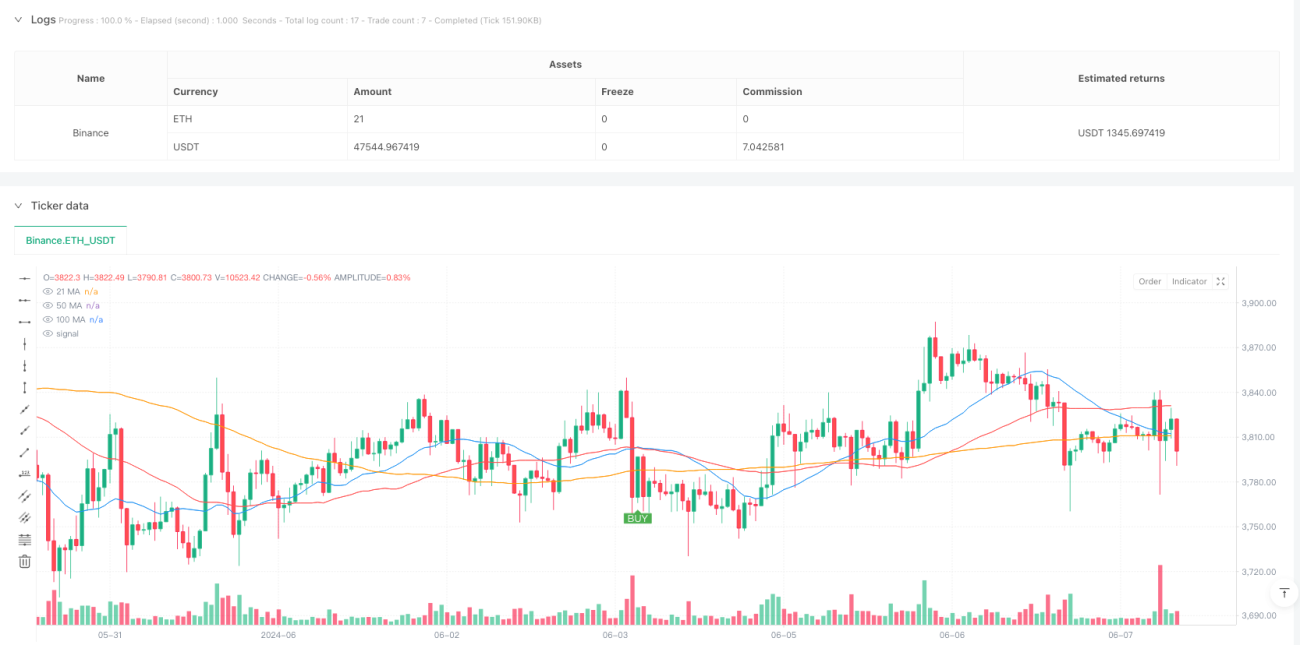
Es handelt sich um eine Trendverfolgungsstrategie, die auf drei einfachen Moving Averages (SMA) basiert. Die Strategie nutzt die Kreuzung und Positionsbeziehung von 21, 50 und 100 Perioden Moving Averages, um Markttrends zu erkennen und zu den richtigen Zeiten zu handeln. Die Strategie läuft hauptsächlich auf einem 5-Minuten-Zeitrahmen und empfiehlt sich zur Trendbestätigung anhand eines 30-Minuten-Charts.
Strategieprinzip
Die Strategie nutzt drei Filtermechanismen, um Handelssignale zu ermitteln:
- Die Verwendung eines 21-Zyklus-Mittels als schnelle Mittellinie, um kurzfristige Preisänderungen zu erfassen
- Die 50-Perioden-Gehaltslinie wird als mittlere Mittellinie verwendet, um ein Kreuzsignal mit der schnellen Mittellinie zu bilden
- Verwendung einer 100-Perioden-Gehrlinie als Trendfilter, um sicherzustellen, dass die Handelsrichtung mit dem Haupttrend übereinstimmt
Gleichzeitig müssen die Kaufbedingungen erfüllt sein:
- Die 21er Durchschnittlinie überschreitet die 50er Durchschnittlinie nach oben.
- Die 21 und die 50 liegen über der 100.
Die Verkaufskonditionen müssen gleichzeitig folgende Bedingungen erfüllen:
- 21 Durchschnitt nach unten durch 50 Durchschnitt
- Die 21 und die 50 liegen unter der 100.
Strategische Vorteile
- Mehrfachbestätigung reduziert Falschmeldungen
- Trendfilter erhöhen die Erfolgsrate
- Klare Ein- und Ausstiegsregeln
- Kann in mehreren Zeitrahmen verwendet werden
- Das Risiko-Rendite-Verhältnis wurde auf 1:2 festgelegt, was für langfristige Gewinne geeignet ist.
- Die Strategie ist einfach zu verstehen und umzusetzen.
Strategisches Risiko
- Schwache Märkte könnten zu häufigen Transaktionen führen
- Durchschnittliche Verzögerung kann zu Ein- und Ausstiegsverzögerungen führen
- Schnelle Kehrtwende könnte zu größeren Verlusten führen
- Anpassung der Parameter für unterschiedliche Marktumstände
Vorschläge zur Risikokontrolle:
- Setzen Sie den Stop-Loss unterhalb des wichtigsten aktuellen Tiefstwerts
- Bestätigung von Trends in Verbindung mit größeren Zeiträumen
- Vermeiden Sie den Handel in schwankenden Märkten
- Regelmäßige Bewertung und Optimierung von Strategieparametern
Richtung der Strategieoptimierung
- Die Einführung von Trendbestätigungsindikatoren für die Transaktionsmenge
- Erhöhung der dynamischen Stop-Loss-Mechanismen
- Trendstärkefilter hinzufügen
- Anpassungsmechanismus für Optimierungsparameter
- Signalbestätigung in Verbindung mit anderen technischen Kennzahlen
- Erhöhung der Marktfluktuations-Filter
Zusammenfassen
Es handelt sich um eine strukturierte, logisch eindeutige Trendverfolgungsstrategie. Durch die Dreifach-Evenline-Filterung und die Trendbestätigungsmechanik kann die falsche Signalübertragung effektiv reduziert und die Erfolgsrate des Handels erhöht werden. Die Strategie ist gut skalierbar und kann entsprechend der verschiedenen Marktbedingungen optimiert werden.
/*backtest
start: 2024-02-21 00:00:00
end: 2024-06-08 00:00:00
period: 1h
basePeriod: 1h
exchanges: [{"eid":"Binance","currency":"ETH_USDT"}]
*/

// This Pine Script™ code is subject to the terms of the Mozilla Public License 2.0 at https://mozilla.org/MPL/2.0/
// © Vezpa
//@version=5
strategy("Vezpa's Gold Strategy", overlay=true)- 1