
Übersicht
Diese Strategie ist ein Handelssystem, das mehrperiodische gleitende Durchschnittsbänder und den MACD-Indikator kombiniert. Die Strategie bestimmt Markttrends und Handelszeitpunkte hauptsächlich durch die Kreuzungen kurzfristiger und langfristiger gleitender Durchschnitte sowie durch Signale des MACD-Indikators. Sie integriert eine Intraday-Handel-Reset-Logik, die Übernachtrisiken wirksam verhindern kann.
Strategieprinzip
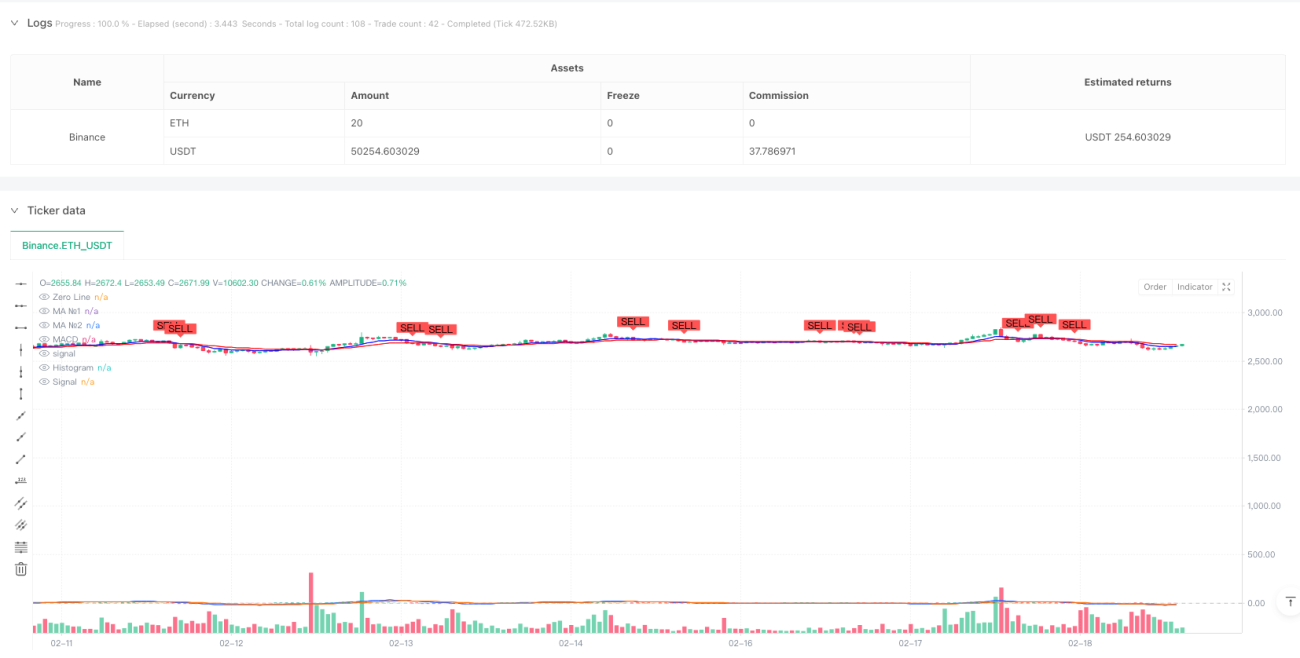
Die Kernlogik der Strategie umfasst drei Hauptteile: das System der gleitenden Durchschnittsbänder, das MACD-Indikatorsystem und den Intraday-Reset-Mechanismus. Die gleitenden Durchschnittsbänder bestehen aus zwei Linien mit unterschiedlichen Perioden (9 und 21) und unterstützen verschiedene Typen gleitender Durchschnitte, darunter SMA, EMA, SMMA, WMA und VWMA. Das MACD-System verwendet die Standardparameter 12/26/9 und bewertet die Trenddynamik anhand der Differenz zwischen der schnellen und der langsamen Linie sowie der Signallinie. Ein Kaufsignal erfordert gleichzeitig, dass der kurzfristige gleitende Durchschnitt den langfristigen nach oben kreuzt und die MACD-Linie die Signallinie nach oben kreuzt. Ein Verkaufssignal wird ausgelöst, wenn eine der umgekehrten Kreuzungen auftritt. Zu Beginn jedes Handelstages werden die Signalzustände zurückgesetzt, um Kontinuität und Sicherheit der Trades zu gewährleisten.
Strategievorteile
- Doppelt zuverlässige Signalbewertung: Die Kombination von Trendfolge- und Momentumindikatoren reduziert das Risiko von Fehlsignalen erheblich.
- Flexible Parametereinstellung: Unterstützt verschiedene Arten von gleitenden Durchschnitten, die je nach Marktmerkmalen optimiert werden können.
- Umfassendes Risikomanagement: Enthält einen Intraday-Reset-Mechanismus, der Übernachtrisiken wirksam vermeidet.
- Hervorragende Visualisierung: Integriert klare Kauf-/Verkaufssignale und die Anzeige der Durchschnittsbänder, was Handelsentscheidungen erleichtert.
Strategierisiken
- Verzögerte Trendwenden: Aufgrund des Einsatzes von gleitenden Durchschnitten kann die Reaktion bei schnellen Marktwendungen langsam sein.
- Ungeeignet für Seitwärtsmärkte: In seitwärts tendierenden Märkten können häufige Fehlsignale auftreten.
- Schwierigkeiten bei der Parameteroptimierung: Die optimalen Parameter können in verschiedenen Marktumgebungen erheblich variieren.
- Auswirkungen von Ausführungsverzögerungen: In volatilen Märkten kann es zu erheblichen Preisunterschieden zwischen Signalbewertung und tatsächlicher Ausführung kommen.
Optimierungsmöglichkeiten der Strategie
- Einführung eines Volatilitätsfilters: Es wird empfohlen, den ATR- oder Volatilitätsindikator hinzuzufügen, um die Signalauslöseschwellen in Umgebungen mit hoher Volatilität anzupassen.
- Optimierung des Signalbewertungsmechanismus: In Betracht gezogen werden kann die Hinzunahme von Volumenbestätigungen oder Preisformationsbestätigungen, um die Signalzuverlässigkeit zu erhöhen.
- Verbesserung des Risikomanagements: Es wird empfohlen, dynamische Stopp-Loss- und Gewinnziele zu integrieren, um das Risiko-Ertrags-Verhältnis der Strategie zu verbessern.
- Anpassung an das Marktumfeld: Parameter können dynamisch an verschiedene Marktzustände angepasst werden, um die Anpassungsfähigkeit der Strategie zu erhöhen.
Zusammenfassung
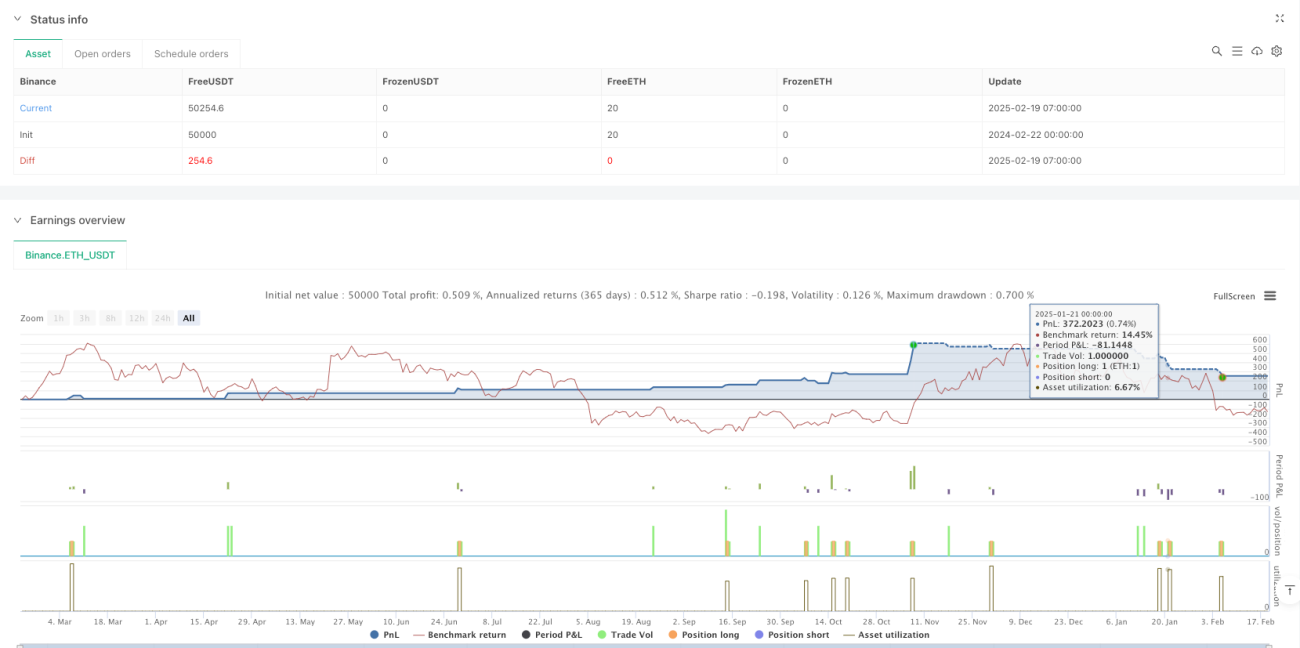
Diese Strategie konstruiert durch die Kombination von gleitenden Durchschnittsbändern und dem MACD-Indikator ein recht vollständiges Handelssystem. Obwohl ein gewisses Risiko von Verzögerungen besteht, kann die Strategie in Trendmärkten durch angemessene Parameteroptimierung und Risikomanagement gute Ergebnisse erzielen. Händlern wird empfohlen, vor dem Einsatz im Live-Handel ausreichende Backtests durchzuführen und die Parametereinstellungen an die spezifischen Marktmerkmale anzupassen.
- 1