Quantitative Triple-Strike-Handelsstrategie basierend auf mehreren K-Linien-Mustern

TLS ECS K-LINE MA PATTERN Trend momentum
Erstellungsdatum: 2025-02-21 11:00:33 zuletzt geändert: 2025-02-27 17:12:20
Kopie: 1 Klicks: 382
2
konzentrieren Sie sich auf
319
Anhänger

Quantitative Triple-Strike-Handelsstrategie basierend auf mehreren K-Linien-Mustern Quantitative Triple-Strike-Handelsstrategie basierend auf mehreren K-Linien-Mustern

Überblick

Es handelt sich um eine quantitative Trading-Strategie, die auf dem Three Line Strike und Engulfing Pattern basiert. Die Strategie erfasst Trendwendepunkte in den Märkten durch die Identifizierung von K-Linien, die nach drei aufeinanderfolgenden K-Linien-Patterns durchbrechen, und kombiniert mehrere technische Indikatoren, um Handelsentscheidungen zu treffen. Die Strategie entwirft ein vollständiges Signalerkennungssystem und Risikokontrollmechanismen und bietet hochgradig anpassbare Parameter-Einstellungen.

Strategieprinzip

Die Kernlogik der Strategie basiert auf zwei Haupt-K-Linienformen:

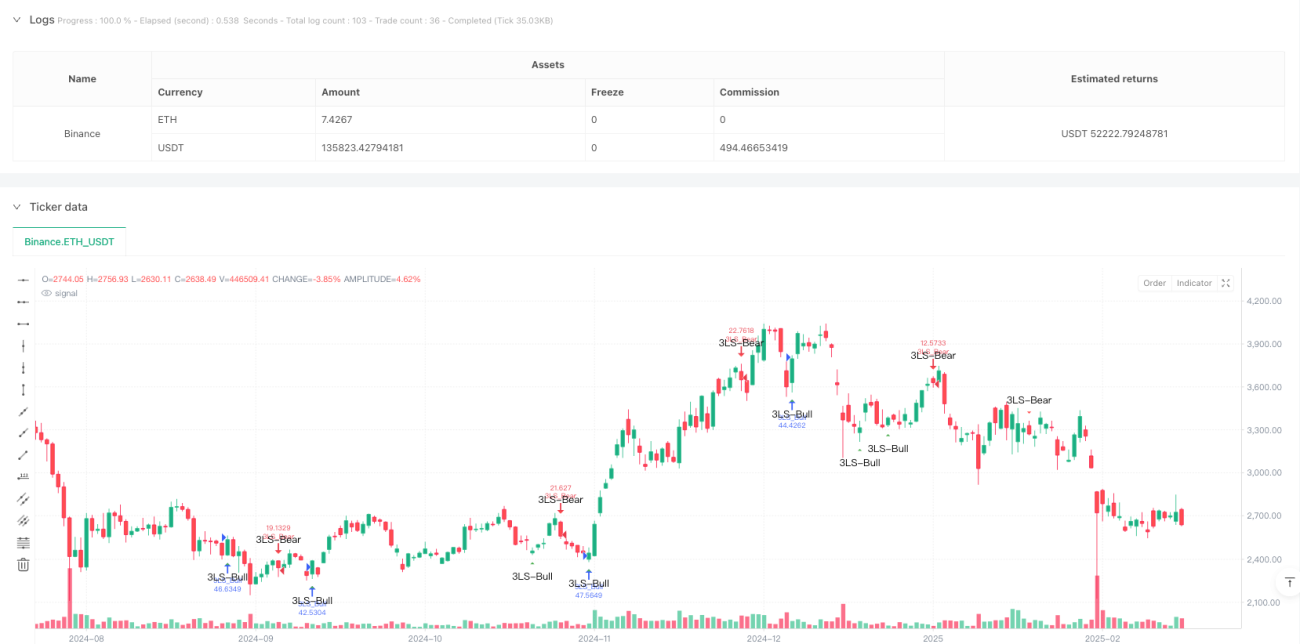
  1. Dreifache Schlagform: Die Trendwende wird durch die Identifizierung von drei aufeinanderfolgenden gleichlaufenden K-Linien beurteilt. Die bullish Form besteht aus drei aufeinanderfolgenden fallenden roten K-Linien, gefolgt von einer größeren grünen K-Linien; die bearish Form besteht aus drei aufeinanderfolgenden steigenden grünen K-Linien, gefolgt von einer größeren roten K-Linien.
  2. Absorptionsform: Ein einzelnes großes Absorptions-K-Signal dient auch als Hilfssignal. Die Strategie erkennt die Absorptionsform an, indem sie die aktuelle K-Linie mit der Größe der vorherigen K-Linie vergleicht.

Strategische Vorteile

  1. Die Signalerkennung ist präzise: Die Strategie verwendet strenge mathematische Berechnungsmethoden, um die K-Linienform zu bestimmen und die Signalqualität durch mehrfache Bedingungen zu gewährleisten.
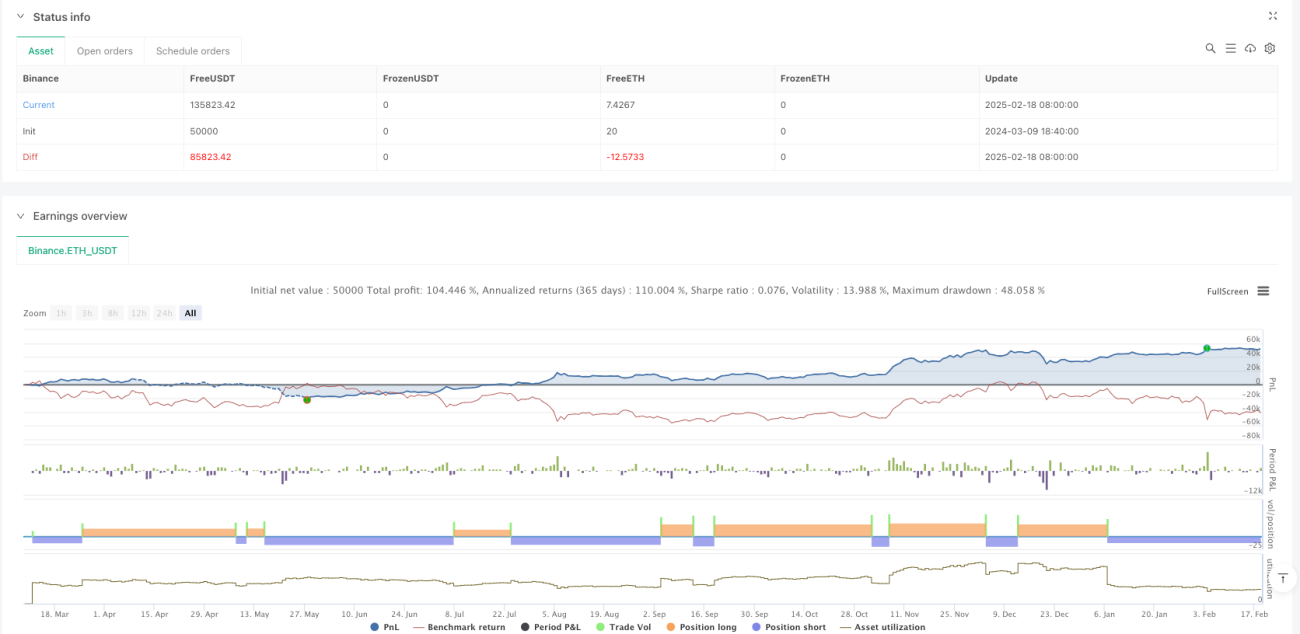
  2. Risikokontrolle: Risikoparameter wie Anfangskapital, Haltungsquote und Verbot von Wiederholung des Eintritts.
  3. Anpassbarkeit der Höhe: Eine Vielzahl von Parameter-Einstellungen, die je nach Markteigenschaften und Handelsbedürfnissen optimiert werden können.
  4. Visuelle Unterstützung: Bereitstellung von klaren grafischen Kennzeichnungen und Hinweisen zur einfachen Analyse und Überwachung.

Strategisches Risiko

  1. Abhängigkeit vom Marktumfeld: In einem wackligen Markt kann es zu viel falsche Signale geben.
  2. Einfluß der Schiebepunkte: Eintrittspunkte von K-Linien mit großer Abnahme können durch einen größeren Einfluß der Schiebepunkte beeinflusst werden.
  3. Verzögerungsrisiko: Die Formerkennung erfordert mehrere K-Linien und kann die beste Eintrittszeit verpassen.

Richtung der Strategieoptimierung

  1. Einführung von Verkehrsmesswerten: Kombination von Verkehrsveränderungen zur Filterung der Signalqualität.
  2. Optimierte Stop-Loss-Einstellungen: Anpassung der Stop-Loss-Position anhand des ATR oder der Fluktuationsrate.
  3. Trend-Filter hinzufügen: Hinzufügen eines Gleichgewichtssystems, um den Gesamttrend zu beurteilen.
  4. Die Einführung eines flexibleren Ausstiegsmechanismus:

Zusammenfassen

Die Strategie erfasst wichtige Marktwendepunkte durch systematische technische Analysemethoden, hat eine starke theoretische Grundlage und praktische Wert. Durch die Optimierung der Parameter und die Verbesserung der Risikokontrolle kann sie als wichtiger Bestandteil eines robusten Handelssystems eingesetzt werden. Die modulare Gestaltung der Strategie bietet auch eine gute Grundlage für weitere Optimierungen.

Overview

This is a quantitative trading strategy based on Three Line Strike and Engulfing patterns. The strategy captures market turning points by identifying breakthrough reversal candlesticks following three consecutive candles, combining multiple technical indicators for trading decisions. It features a complete signal detection system and risk control mechanism, with highly customizable parameter settings.

Strategy Principle

The core logic is based on two main candlestick patterns:

  1. Three Line Strike Pattern: Identifies trend reversals through three consecutive same-direction candles followed by a reversal candle. Bullish pattern consists of three consecutive red candles followed by a large green engulfing candle; bearish pattern consists of three consecutive green candles followed by a large red engulfing candle.
  2. Engulfing Pattern: Large single engulfing candles serve as auxiliary signals. The strategy identifies engulfing patterns by comparing the body size of current and previous candles.

Strategy Advantages

  1. Precise Signal Identification: Uses strict mathematical calculations to judge candlestick patterns, ensuring signal quality through multiple condition filtering.
  2. Comprehensive Risk Control: Includes risk parameters like initial capital and position sizing, with pyramiding prevention.
  3. Highly Customizable: Offers rich parameter settings for optimization according to different market characteristics and trading needs.
  4. Visual Support: Provides clear graphical markers and alert messages for analysis and monitoring.

Strategy Risks

  1. Market Environment Dependency: May generate excessive false signals in ranging markets.
  2. Slippage Impact: Entry points for large engulfing candles may be subject to significant slippage.
  3. Delay Risk: Pattern recognition requires multiple candles, potentially missing optimal entry points.

Optimization Directions

  1. Incorporate Volume Indicators: Filter signal quality by combining volume changes.
  2. Optimize Stop Loss Settings: Dynamically adjust stop loss positions based on ATR or volatility.
  3. Add Trend Filtering: Implement moving average systems to judge overall trend.
  4. Improve Exit Mechanism: Design more flexible profit-taking conditions.

Summary

The strategy captures important market turning points through systematic technical analysis, with strong theoretical foundation and practical value. Through parameter optimization and risk control refinement, it can serve as an important component of a robust trading system. The modular design also provides a good foundation for further optimization.

Strategiequellcode
/*backtest
start: 2024-03-09 18:40:00
end: 2025-02-19 08:00:00
period: 1d
basePeriod: 1d
exchanges: [{"eid":"Binance","currency":"ETH_USDT"}]
*/

// Copyright ...
// Based on the TMA Overlay by Arty, converted to a simple strategy example.
// Pine Script v5

//@version=5
strategy(title='3 Line Strike [TTF] - Strategy',
     shorttitle='3LS Strategy [TTF]',
     overlay=true,
     initial_capital=100000,
     default_qty_type=strategy.percent_of_equity,
     default_qty_value=100,
     pyramiding=0)

// -----------------------------------------------------------------------------
//                               INPUTS
// -----------------------------------------------------------------------------

//
// ### 3 Line Strike
//
showBear3LS = input.bool(title='Show Bearish 3 Line Strike', defval=true, group='3 Line Strike',
     tooltip="Bearish 3 Line Strike (3LS-Bear) = 3 green candles followed by a large red candle (engulfing).")
showBull3LS = input.bool(title='Show Bullish 3 Line Strike', defval=true, group='3 Line Strike',
     tooltip="Bullish 3 Line Strike (3LS-Bull) = 3 red candles followed by a large green candle (engulfing).")
showMemeChars = input.bool(title="Plot 3 Line Strike meme symbols", defval=false, group="3 Line Strike")

//
//### Engulfing Candles
//
showBearEngulfing= input.bool(title='Show Bearish Big Candles', defval=false, group='Big Candles')
showBullEngulfing= input.bool(title='Show Bullish Big Candles', defval=false, group='Big Candles')

//
//### Alerts
//
void = input.bool(title="(Info) Alerts are based on detected signals.", defval=true)

// -----------------------------------------------------------------------------
//                          HELPER FUNCTIONS
// -----------------------------------------------------------------------------

// Function: Get the 'color' of the candle: -1 = red, 0 = doji, +1 = green
getCandleColorIndex(barIndex) =>
    int ret = na
    if (close[barIndex] > open[barIndex])
        ret := 1
    else if (close[barIndex] < open[barIndex])
        ret := -1
    else
        ret := 0
    ret

// Function: Check if the candle is engulfing (based on the body size of the candles)
isEngulfing(checkBearish) =>
    // Size of the previous candle
    sizePrevCandle = close[1] - open[1]
    // Size of the current candle
    sizeCurrentCandle = close - open
    isCurrentLargerThanPrevious = math.abs(sizeCurrentCandle) > math.abs(sizePrevCandle)
    
    // Bearish / Bullish division
    if checkBearish
        // Bearish engulfing: previous green, current larger red
        isGreenToRed = (getCandleColorIndex(0) < 0) and (getCandleColorIndex(1) > 0)
        isCurrentLargerThanPrevious and isGreenToRed
    else
        // Bullish engulfing: previous red, current larger green
        isRedToGreen = (getCandleColorIndex(0) > 0) and (getCandleColorIndex(1) < 0)
        isCurrentLargerThanPrevious and isRedToGreen

// Simplified calls for bullish/bearish engulfing
isBearishEngulfing() => isEngulfing(true)
isBullishEngulfing() => isEngulfing(false)

// Function: 3 consecutive candles of one color followed by the opposite engulfing candle
// 3 Line Strike - Bearish
is3LSBear() =>
    // Three consecutive green candles?
    is3LineSetup = (getCandleColorIndex(1) > 0) and (getCandleColorIndex(2) > 0) and (getCandleColorIndex(3) > 0)
    // Followed by Bearish engulfing
    is3LineSetup and isBearishEngulfing()

// 3 Line Strike - Bullish
is3LSBull() =>
    // Three consecutive red candles?
    is3LineSetup = (getCandleColorIndex(1) < 0) and (getCandleColorIndex(2) < 0) and (getCandleColorIndex(3) < 0)
    // Followed by Bullish engulfing
    is3LineSetup and isBullishEngulfing()

// -----------------------------------------------------------------------------
//                             SIGNALS
// -----------------------------------------------------------------------------

// ### 3 Line Strike
is3LSBearSig = is3LSBear()
is3LSBullSig = is3LSBull()

// Meme icons vs. standard shapes
plotchar(showBull3LS and showMemeChars ? is3LSBullSig : na, char="🍆", color=color.rgb(0, 255, 0, 0),
         location=location.belowbar, size=size.tiny, text='3LS-Bull', title='3 Line Strike Up (Meme Icon)', editable=false)
plotchar(showBear3LS and showMemeChars ? is3LSBearSig : na, char="🍑", color=color.rgb(255, 0, 0, 0),
         location=location.abovebar, size=size.tiny, text='3LS-Bear', title='3 Line Strike Down (Meme Icon)', editable=false)

plotshape(showBull3LS and not showMemeChars ? is3LSBullSig : na, style=shape.triangleup,
         color=color.green, location=location.belowbar, size=size.small, text='3LS-Bull', title='3 Line Strike Up')
plotshape(showBear3LS and not showMemeChars ? is3LSBearSig : na, style=shape.triangledown,
         color=color.red, location=location.abovebar, size=size.small, text='3LS-Bear', title='3 Line Strike Down')

// ### Engulfing Candles
isBullEngulfingSig = isBullishEngulfing()
isBearEngulfingSig = isBearishEngulfing()

plotshape(showBullEngulfing ? isBullEngulfingSig : na, style=shape.triangleup,
         location=location.belowbar, color=color.new(color.green,0), size=size.tiny, title='Big Candle Up')
plotshape(showBearEngulfing ? isBearEngulfingSig : na, style=shape.triangledown,
         location=location.abovebar, color=color.new(color.red,0), size=size.tiny, title='Big Candle Down')

// -----------------------------------------------------------------------------
//                               ALERTS
// -----------------------------------------------------------------------------

// 3LS - "Old" alertcondition + "New" alert() (based on what people use)
alertcondition(showBull3LS and is3LSBullSig, title='Bullish 3 Line Strike',
     message='{{exchange}}:{{ticker}} {{interval}} - Bullish 3 Line Strike')
alertcondition(showBear3LS and is3LSBearSig, title='Bearish 3 Line Strike',
     message='{{exchange}}:{{ticker}} {{interval}} - Bearish 3 Line Strike')

if (showBull3LS and is3LSBullSig)
    m = syminfo.tickerid + ' ' + timeframe.period + ' - Bullish 3 Line Strike'
    alert(message=str.tostring(m), freq=alert.freq_once_per_bar_close)

if (showBear3LS and is3LSBearSig)
    m = syminfo.tickerid + ' ' + timeframe.period + ' - Bearish 3 Line Strike'
    alert(message=str.tostring(m), freq=alert.freq_once_per_bar_close)

// Engulfing - "Old" alertcondition + "New" alert()
alertcondition(showBullEngulfing and isBullEngulfingSig, title='Bullish Engulfing',
     message='{{exchange}}:{{ticker}} {{interval}} - Bullish candle engulfing previous candle')
alertcondition(showBearEngulfing and isBearEngulfingSig, title='Bearish Engulfing',
     message='{{exchange}}:{{ticker}} {{interval}} - Bearish candle engulfing previous candle')

if (showBullEngulfing and isBullEngulfingSig)
    m = syminfo.tickerid + ' ' + timeframe.period + ' - Bullish candle engulfing previous candle'
    alert(message=str.tostring(m), freq=alert.freq_once_per_bar_close)

if (showBearEngulfing and isBearEngulfingSig)
    m = syminfo.tickerid + ' ' + timeframe.period + ' - Bearish candle engulfing previous candle'
    alert(message=str.tostring(m), freq=alert.freq_once_per_bar_close)

// -----------------------------------------------------------------------------
//                          STRATEGY ENTRY ORDERS
// -----------------------------------------------------------------------------
//
// Logic for entering trades. If display is enabled and a signal is detected, a trade will be entered.
//
// 3 Line Strike
if (showBull3LS and is3LSBullSig)
    strategy.entry("3LS_Bull", strategy.long, comment="3LS Bullish")

if (showBear3LS and is3LSBearSig)
    strategy.entry("3LS_Bear", strategy.short, comment="3LS Bearish")

// Engulfing
if (showBullEngulfing and isBullEngulfingSig)
    strategy.entry("BullEngulf", strategy.long, comment="Bullish Engulfing")

if (showBearEngulfing and isBearEngulfingSig)
    strategy.entry("BearEngulf", strategy.short, comment="Bearish Engulfing")

//
// End of script