
Überblick
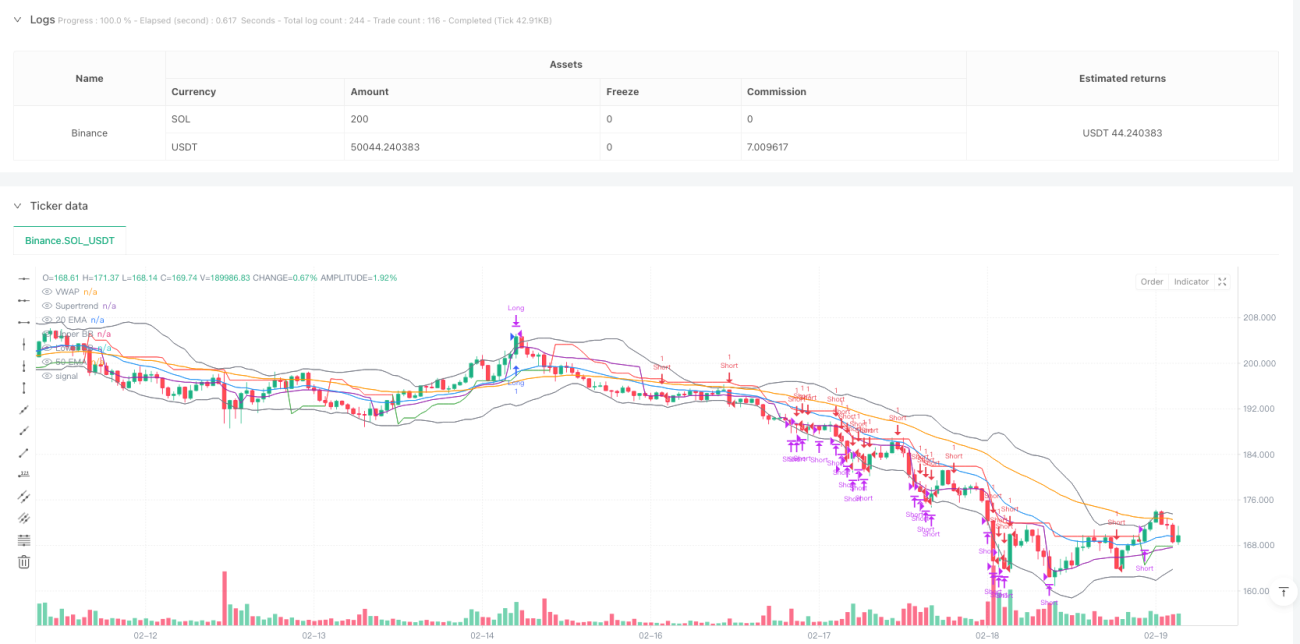
Die Strategie ist ein selbstappierendes Handelssystem, das Trendverfolgung und Split-Trading kombiniert. Sie arbeitet mit mehreren technischen Indikatoren zusammen und wechselt flexibel zwischen verschiedenen Handelsmodellen in verschiedenen Marktumgebungen. Die Strategie verwendet Indikatoren wie Supertrend, Moving Average, ADX, RSI und Bollinger Bands, um Marktzustände zu identifizieren und Handelssignale zu ermitteln, während sie in Verbindung mit VWAP für Preisreferenzen verwendet wird und ein Stop-Loss-Mechanismus zur Risikokontrolle eingerichtet wird.
Strategieprinzip
Die Kernlogik der Strategie besteht aus zwei Teilen: Trend-Tracking und Split-Trading. In Trendmärkten (beurteilt durch ADX> 25) erzeugt die Strategie Signale basierend auf der Supertrend-Richtung, EMA-Kreuzungen und VWAP-Positionen.
- Trend-Tracking-Modus: aktiviert, wenn ADX> 25, kombiniert mit 20/50-Zyklus EMA positionale Beziehung, Supertrend Richtung und Preis gegenüber VWAP Position zusammenfassende Beurteilung
- Intervall-Trading-Modus: Aktiviert bei ADX<25 und eingeschaltet, wenn der Preis die Brin-Band-Grenze erreicht und der RSI seine Höchstwerte erreicht
- Ausgangskonditionen umfassen: Stop loss ausgelöst, Supertrend umgedreht oder RSI erreicht die Extreme
Strategische Vorteile
- Anpassungsfähigkeit: Fähigkeit, automatisch zwischen Handelsmodellen zu wechseln, je nach Marktlage
- Mehrfachbestätigung: Mehrfachbestätigung mit mehreren Kennzahlen erhöht die Signalsicherheit
- Perfekte Risikokontrolle: Festgelegte Stop-Loss-Prozentsätze und dynamische Anpassungen mit RSI-Höchstwerten
- Allgemeinheit: Trends erkennen und profitieren bei Marktschwankungen
- Visuelle Unterstützung: Graphische Darstellung wichtiger Kennzahlen zur Analyse und Entscheidungsfindung
Strategisches Risiko
- Parameter-Sensitivität: Einstellungen für mehrere Kennzahlen-Parameter beeinflussen die Strategie-Performance
- Signalrückstand: Technische Indikatoren selbst sind etwas rückständig
- Falsche Durchbruchrisiken: Falsche Signale auf dem OTC-Markt
- Komplexität der Berechnung: Die Berechnung mehrerer Kennzahlen in Echtzeit kann die Effizienz der Ausführung beeinträchtigen
- Marktadaptivität: unter bestimmten Umständen schlechte Performance
Richtung der Strategieoptimierung
- Dynamische Parameter-Anpassung: Die Parameter der einzelnen Indikatoren können automatisch an die Schwankungen angepasst werden
- Einführung von Traffic Analysis: Erhöhung der Traffic Indicators zur Überprüfung der Signalwirksamkeit
- Optimierung der Stop-Loss-Mechanismen: Die Verwendung von ATR-Dynamic Stop-Loss kann in Erwägung gezogen werden
- Zeitfilter hinzugefügt: Hinzufügen von Handelszeitfenstern, um ineffiziente Zeiten zu vermeiden
- Market Sentiment Indicators: Integration von Market Sentiment Indicators zur Verbesserung der Prognose-Genauigkeit
Zusammenfassen
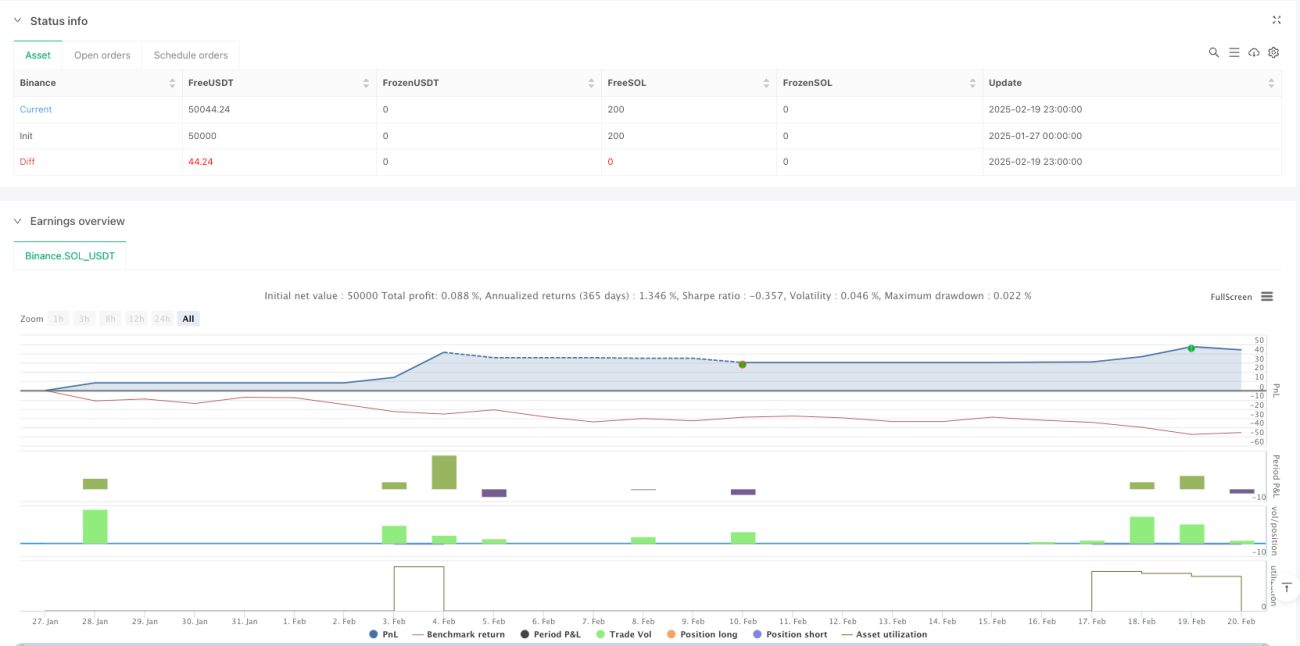
Es handelt sich um eine durchdachte, logisch integrierte Strategie. Durch die Kombination mehrerer Indikatoren und die Umschaltung von Modellen kann eine gewisse Anpassungsfähigkeit in verschiedenen Marktumgebungen beibehalten werden. Obwohl einige potenzielle Risiken bestehen, hat die Strategie durch vernünftige Risikokontrolle und kontinuierliche Optimierung einen guten praktischen Einsatzwert.
- 1