Adaptive Trendhandelsstrategie mit Mehrindikator-Fusion

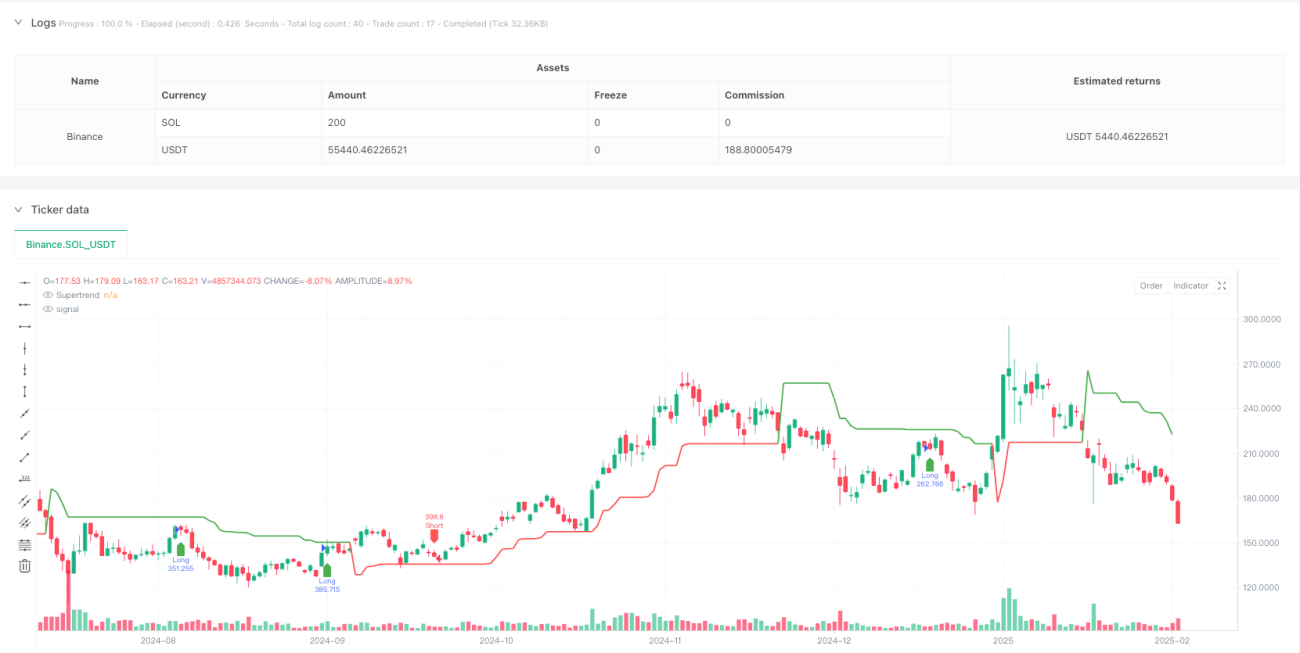
Überblick
Diese Strategie ist ein adaptives Trendfolge-Handelssystem, das mehrere technische Indikatoren integriert. Es kombiniert Gleitende Durchschnitte (EMA), Momentum-Indikator (RSI), Trend-Indikator (MACD) und SuperTrend zur Signalbestätigung und ist mit einem umfassenden Risikomanagement ausgestattet, einschließlich Stop-Loss, Take-Profit und Trailing-Stop-Funktionen. Das Strategiedesign berücksichtigt die Marktvolatilität vollständig und verbessert durch mehrfache Signalfilterung und Risikokontrolle die Stabilität und Zuverlässigkeit des Handels.
Strategieprinzip
Die Strategie verwendet einen mehrschichtigen Signalbestätigungsmechanismus:
- Bestimmung der anfänglichen Trendrichtung durch den Crossover der 9- und 21-Perioden-EMA
- Verwendung des RSI (14) zur Filterung von überkauften/überverkauften Bedingungen: Kaufsignal erfordert RSI>40 und <70, Verkaufssignal erfordert RSI<60 und >30
- MACD-Indikator bestätigt die Trenddynamik: Die Signallinie muss in die gleiche Richtung wie die MACD-Linie zeigen
- SuperTrend-Indikator liefert zusätzliche Trendbestätigung
- Risikokontrolle mit 5% Stop-Loss, 10% Take-Profit, 2% Trailing-Stop und 1% Break-Even-Punkt
Ein Handelssignal wird nur ausgelöst, wenn alle Bedingungen gleichzeitig erfüllt sind, wodurch das Risiko von Fehlsignalen durch falsche Ausbrüche effektiv reduziert wird.
Strategievorteile
- Mehrfache Signalbestätigungsmechanismen reduzieren Fehlsignale erheblich
- Umfassendes Risikokontrollsystem mit festem Stop-Loss, Trailing-Stop und Break-Even-Stop
- Die Strategie ist gut anpassungsfähig und kann sich an verschiedene Marktumgebungen anpassen
- Klare Ein- und Ausstiegslogik, leicht verständlich und wartbar
- Die Handelslogik hat eine solide theoretische Basis, jeder Indikator hat seine spezifische Funktion
Strategierisiken
- Mehrfache Signalbestätigung kann dazu führen, dass einige wichtige Handelsmöglichkeiten verpasst werden
- In stark volatilen Märkten können feste Stop-Loss-Niveaus zu unflexibel sein
- Parameteroptimierung kann zu einer Überanpassung an historische Daten führen
- Mehrere Indikatoren können in Seitwärtsmärkten widersprüchliche Signale erzeugen
Lösungsansätze umfassen: dynamische Anpassung der Stop-Loss-Parameter, Einführung von Volatilitätsindikatoren, regelmäßige Neuoptimierung der Parameter usw.
Optimierungsrichtungen
- Einführung eines adaptiven Parameter-Mechanismus zur dynamischen Anpassung der Parameter basierend auf der Marktvolatilität
- Hinzufügen von Volumenindikatoren als zusätzliches Bestätigungswerkzeug
- Optimierung des Stop-Loss-Mechanismus durch Einführung eines ATR-basierten dynamischen Stop-Loss
- Integration eines Marktumfeld-Erkennungsmoduls, um in verschiedenen Marktbedingungen unterschiedliche Parametersätze zu verwenden
- Entwicklung eines auf maschinellem Lernen basierenden Parameteroptimierungssystems
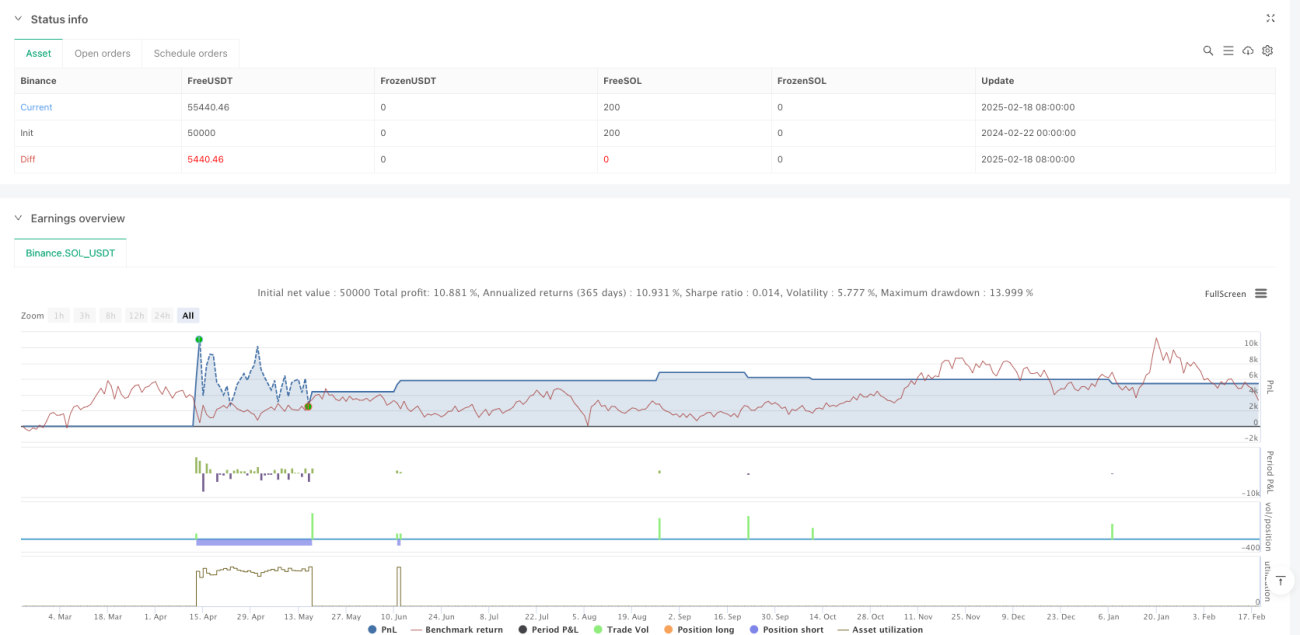
Zusammenfassung
Diese Strategie schafft durch das Zusammenwirken mehrerer technischer Indikatoren ein robustes Handelssystem. Das umfassende Risikomanagement und die klare Handelslogik verleihen ihr eine hohe Praxistauglichkeit. Obwohl es gewissen Optimierungsspielraum gibt, hat das grundlegende Rahmenwerk der Strategie eine solide theoretische Grundlage. Durch kontinuierliche Optimierung und Verbesserung kann die Handelseffektivität weiter gesteigert werden.
/*backtest
start: 2024-02-22 00:00:00
end: 2025-02-19 08:00:00
period: 1d
basePeriod: 1d
exchanges: [{"eid":"Binance","currency":"SOL_USDT"}]
*/

//@version=5
strategy("Optimized BTC Trading Strategy v2", overlay=true, default_qty_type=strategy.percent_of_equity, default_qty_value=100, commission_type=strategy.commission.percent, commission_value=0.1)

// Input parameters- 1