Intelligentes mehrdimensionales adaptives Trendhandelssystem

Überblick
Die Strategie ist ein intelligentes Handelssystem, das mehrere technische Kennzahlen kombiniert, um Marktchancen durch eine umfassende Analyse der Fair Value Gap (FVG), Trendsignale und Preisverhaltens zu identifizieren. Das System verwendet eine Dual-Strategie-Mechanismus, kombiniert mit Trend-Tracking und Bandbreiten-Trading-Eigenschaften, um die Handelsleistung durch dynamische Positionsmanagement und mehrdimensionale Ausstiegsmechanismen zu optimieren. Die Strategie legt besonderen Wert auf Risikokontrolle, um die Signalqualität durch Volatilitätsfilterung und Bestätigung von Transaktionen zu verbessern.
Strategieprinzip
Die Kernlogik der Strategie basiert auf folgenden Dimensionen:
- FVG-Lückenerkennung - Suche nach potenziellen Handelsmöglichkeiten durch Berechnung der Größe der Preissprunglücke
- Trendbestätigungssystem - die Bestätigung von Markttrends in Kombination mit dem 200-Tage-Durchschnittswert, dem SuperTrend-Indikator und dem MACD
- Intelligente Kapitalbestätigung - mit RSI-Überkauf, Überverkauf, Transaktionsanomalien und Preisverhaltensmustern als Triggerbedingungen für Transaktionen
- Dynamisches Positionsmanagement - Positionsgröße wird anhand der ATR-Schwankungen angepasst, um die Einheitlichkeit der Risikoplätze zu gewährleisten
- Mehrstufige Ausstiegsmechanismen - Verwalten von Ausstiegsgeschäften in Kombination mit Tracking-Stopps und Zielstopps
Strategische Vorteile
- Anpassungsfähigkeit - Strategien können die Parameter und Positionen automatisch an die Marktfluktuation anpassen
- Perfekte Risikokontrolle - Risiken durch mehrere Filter und strenge Positionsverwaltung
- Signalqualität ist zuverlässig - die Genauigkeit von Handelssignalen wird durch die Bestätigung von mehrdimensionalen Kennzahlen verbessert
- Flexible Handelsmethoden - Möglichkeiten, Trends und Schwankungen gleichzeitig zu erfassen
- Die Wissenschaft des Geldmanagements - Prozentsatzrisikomanagement, um die Rationalität der Verwendung von Geldern zu gewährleisten
Strategisches Risiko
- Parameter-Sensitivität - Einstellungen mit mehreren Parametern können die Strategie-Performance beeinflussen und müssen kontinuierlich optimiert werden
- Marktumgebungsabhängigkeit - Unter bestimmten Marktbedingungen können falsche Durchbruchsignale auftreten
- Schlupfwirkung - in weniger flüssigen Märkten können größere Schlupfwellen auftreten
- Komplexität der Berechnung - die Berechnung mehrerer Indikatoren kann zu Signalverzögerungen führen
- Hohe Finanzierungsbedürfnisse - eine umfassende Umsetzung der Strategie erfordert einen hohen Anfangskapitalbedarf
Richtung der Strategieoptimierung
- Gewichtsoptimierung der Kennzahlen - Einführung von maschinellen Lernmethoden, um die Gewichte der einzelnen Kennzahlen dynamisch anzupassen
- Erhöhung der Marktadaptivität - Anpassungsmechanismen zur Erhöhung der Marktvolatilität
- Verbesserte Signalfilterung - Einführung weiterer Mikrostrukturindikatoren
- Optimierung der Abwicklungsmechanismen - Erhöhung der Intelligenz der Auftragsspaltung und Reduzierung der Stoßkosten
- Risikokontroll-Aufwertung - Erweiterung der dynamischen Risikobudgetmanagement-Systeme
Zusammenfassen
Die Strategie baut ein vollständiges Handelssystem auf, indem sie mehrere technische Indikatoren und Handelstechniken kombiniert. Ihr Vorteil besteht darin, sich an Marktveränderungen anzupassen, während sie eine strenge Risikokontrolle beibehält. Obwohl es einen gewissen Optimierungsraum gibt, ist es insgesamt eine vernünftige quantitative Handelsstrategie.
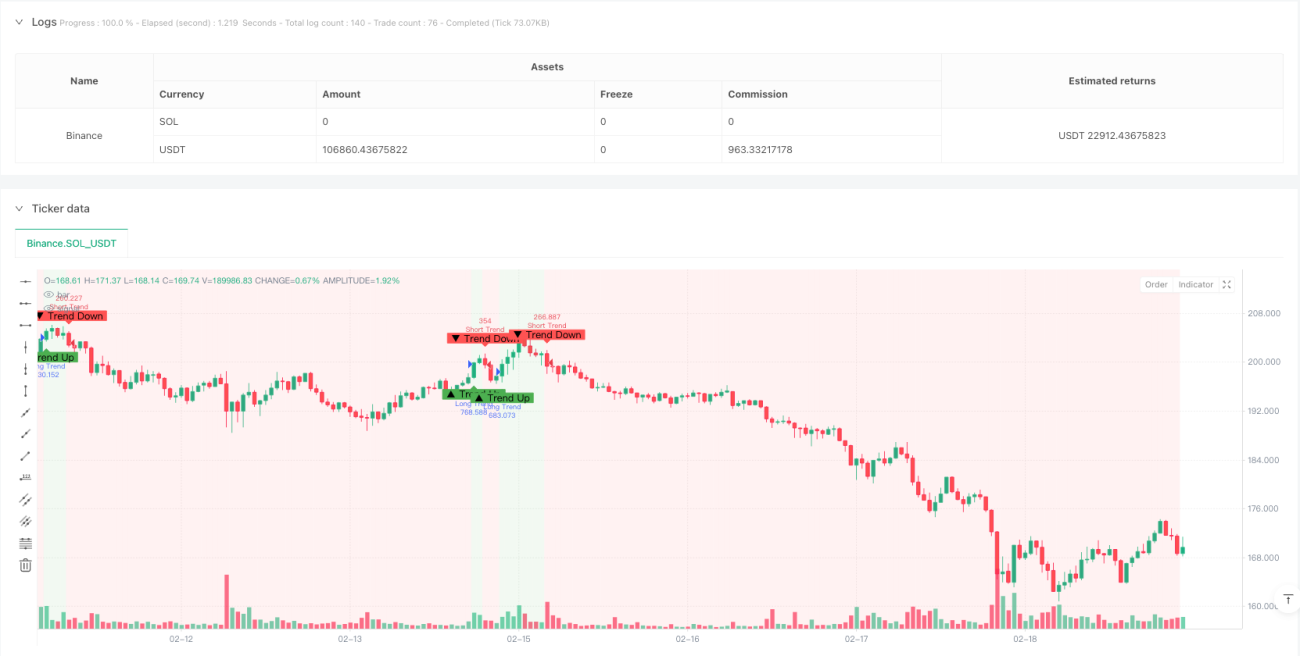
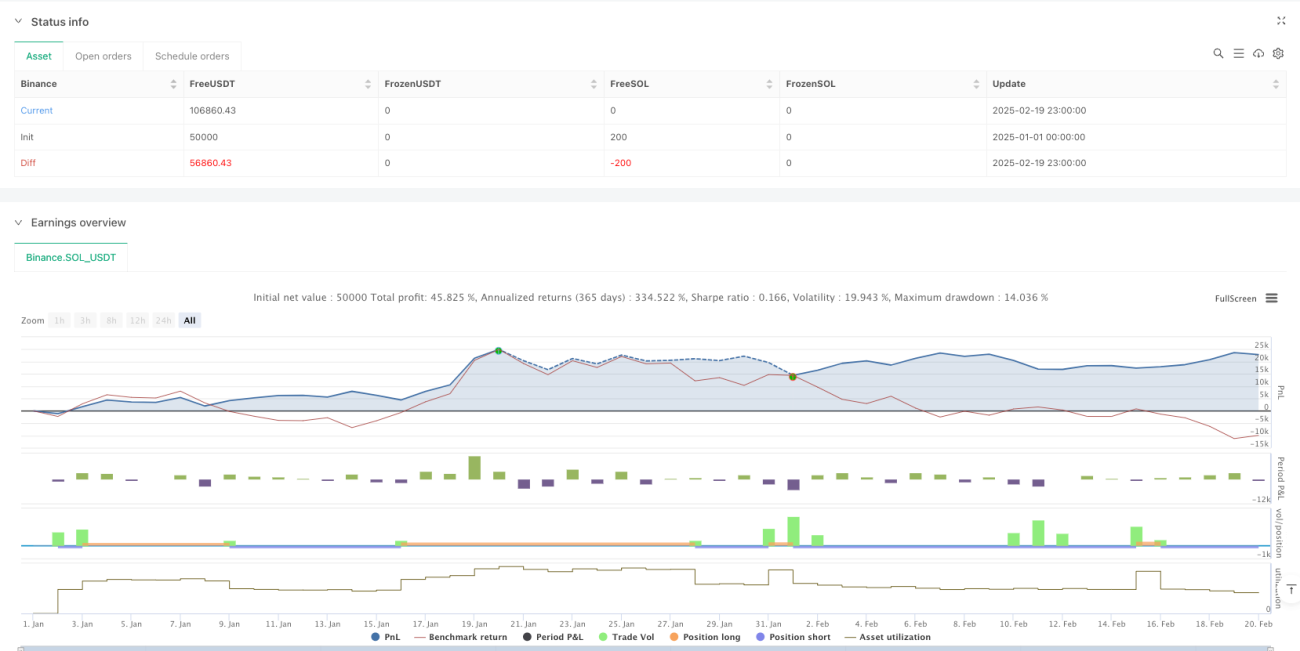
/*backtest
start: 2025-01-01 00:00:00
end: 2025-02-20 00:00:00
period: 1h
basePeriod: 1h
exchanges: [{"eid":"Binance","currency":"SOL_USDT"}]
*/

//@version=6
strategy("Adaptive Trend Signals", overlay=true, margin_long=100, margin_short=100, pyramiding=1, initial_capital=50000, default_qty_type=strategy.percent_of_equity, default_qty_value=100, commission_type=strategy.commission.percent, commission_value=0.075)

// 1. Enhanced Inputs with Debugging Options- 1