Adaptive Bollinger Grid-Handelsstrategie

Überblick
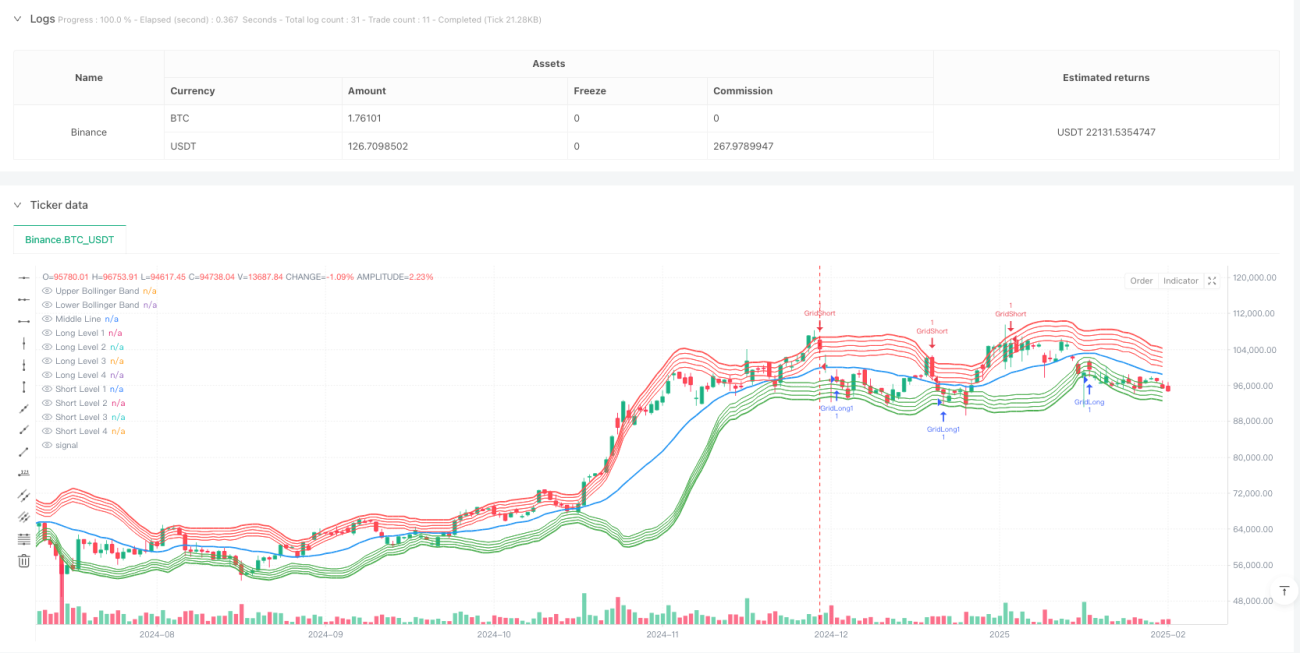
Es handelt sich um eine hochmoderne Grid-Trading-Strategie, die auf den Brin-Band-Indikatoren basiert. Die Strategie bestimmt die Position des Grids durch die dynamische Entwicklung der oberen und unteren Bahnen des Brin-Bands und passt die Grid-Intervalle automatisch an die Marktvolatilität an. Das System führt entsprechende Multi-Block-Tradings durch, wenn der Preis die Grid-Linie durchbricht, was einen vollautomatischen Grid-Trading ermöglicht.
Strategieprinzip
Die Strategie verwendet einen 20-Zyklen-Moving Average als Mittelschiene für den Brinband und eine doppelte Standardabweichung als Bandbreite. Auf der Basis des Brinbands sind 4 Gitterstufen mit einem Gitterintervall von 1% zwischen den oberen und unteren Schienen eingerichtet. Wenn der Preis eine bestimmte Gitterlinie nach oben durchbricht, führt das System mehrere Operationen aus.
Strategische Vorteile
- Dynamische Anpassung - Die Gridposition bewegt sich mit der Brin-Band, so dass die Strategie sich an unterschiedliche Marktumstände anpasst
- Risikokontrolle - Handelsplatz durch Brin-Band begrenzt, um übermäßige Positionen in Extremsituationen zu vermeiden
- Hochgradige Automatisierung - System, das Transaktionen automatisch ausführt, ohne menschliche Intervention
- Zwei-Wege-Trading - profitieren Sie sowohl bei steigenden als auch bei rückläufigen Trends
- Parameter sind verstellbar - die Gridspannweite und die Anzahl der Ebenen kann flexibel angepasst werden
Strategisches Risiko
- Trendmarktrisiken - bei einseitigen Trends kann es zu einem größeren Rückzug kommen
- Risiken bei der Vermögensverwaltung - mehrere Grids gleichzeitig ausgelöst können zu übermäßigen Positionen führen
- Schlupfrisiko - bei starken Marktschwankungen kann es zu einer Abweichung der Transaktionspreise von den Nettopreisen kommen
- Technische Risiken - Falsche Durchbruchsignale im Brin-Band
Lösung:
- Setzen Sie eine Gesamtpositionsbeschränkung
- Einführung eines Trendfilters
- Optimierung der Auftragsabwicklung
- Zusätzliche Filter für Bestätigungssignale
Richtung der Strategieoptimierung
- Adaptive Rasterspannung - Anpassung der Rasterspannung an die dynamische Schwankungsrate
- Die Einführung von Preis-Leistungs-Beziehungen - Zeit für die Optimierung des Eintritts in Kombination mit Umsatzindikatoren
- Optimierung der Stop-Loss-Mechanismen - Gestaltung von flexibleren Stop-Loss-Systemen
- Optimierung der Kapitalverwaltung - Risikobasierte Positionsverwaltung
- Multi-Zeit-Zyklus-Synchronisierung - Einführung eines Multi-Zyklus-Signal-Bestätigungsmechanismus
Zusammenfassen
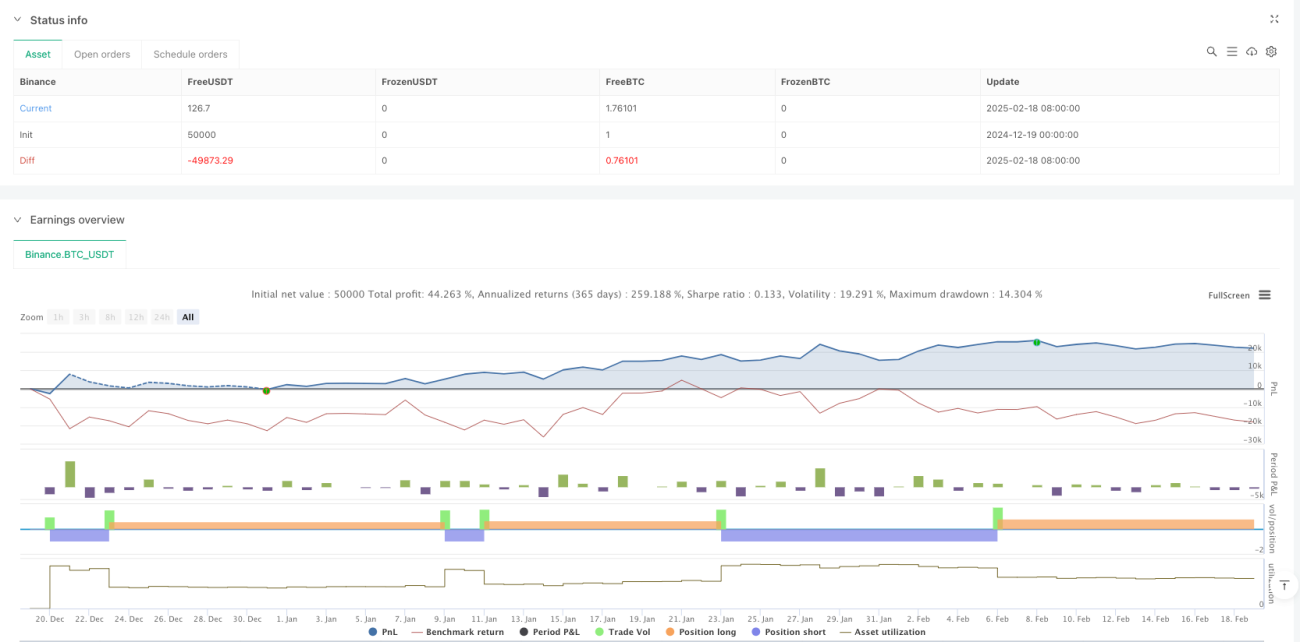
Durch die Kombination von Brin-Band- und Grid-Trading wird ein automatisiertes Handelssystem mit Flexibilität und Stabilität realisiert. Die Kernvorteile der Strategie liegen in der Fähigkeit, sich an verschiedene Marktumgebungen anzupassen und gleichzeitig Risikokontrolle durch Parameteranpassung zu erreichen. Obwohl einige inhärente Risiken bestehen, kann ein robusteres Handelssystem durch kontinuierliche Optimierung und Verbesserung aufgebaut werden.
- 1